Many of the same conditions we found on Litecoin’s (LTC) chart during yesterday’s analysis is also present on Ethereum’s (ETH) chart.
Ethereum at a make or break level
 Ethereum (ETH) key breakdown levels ahead.
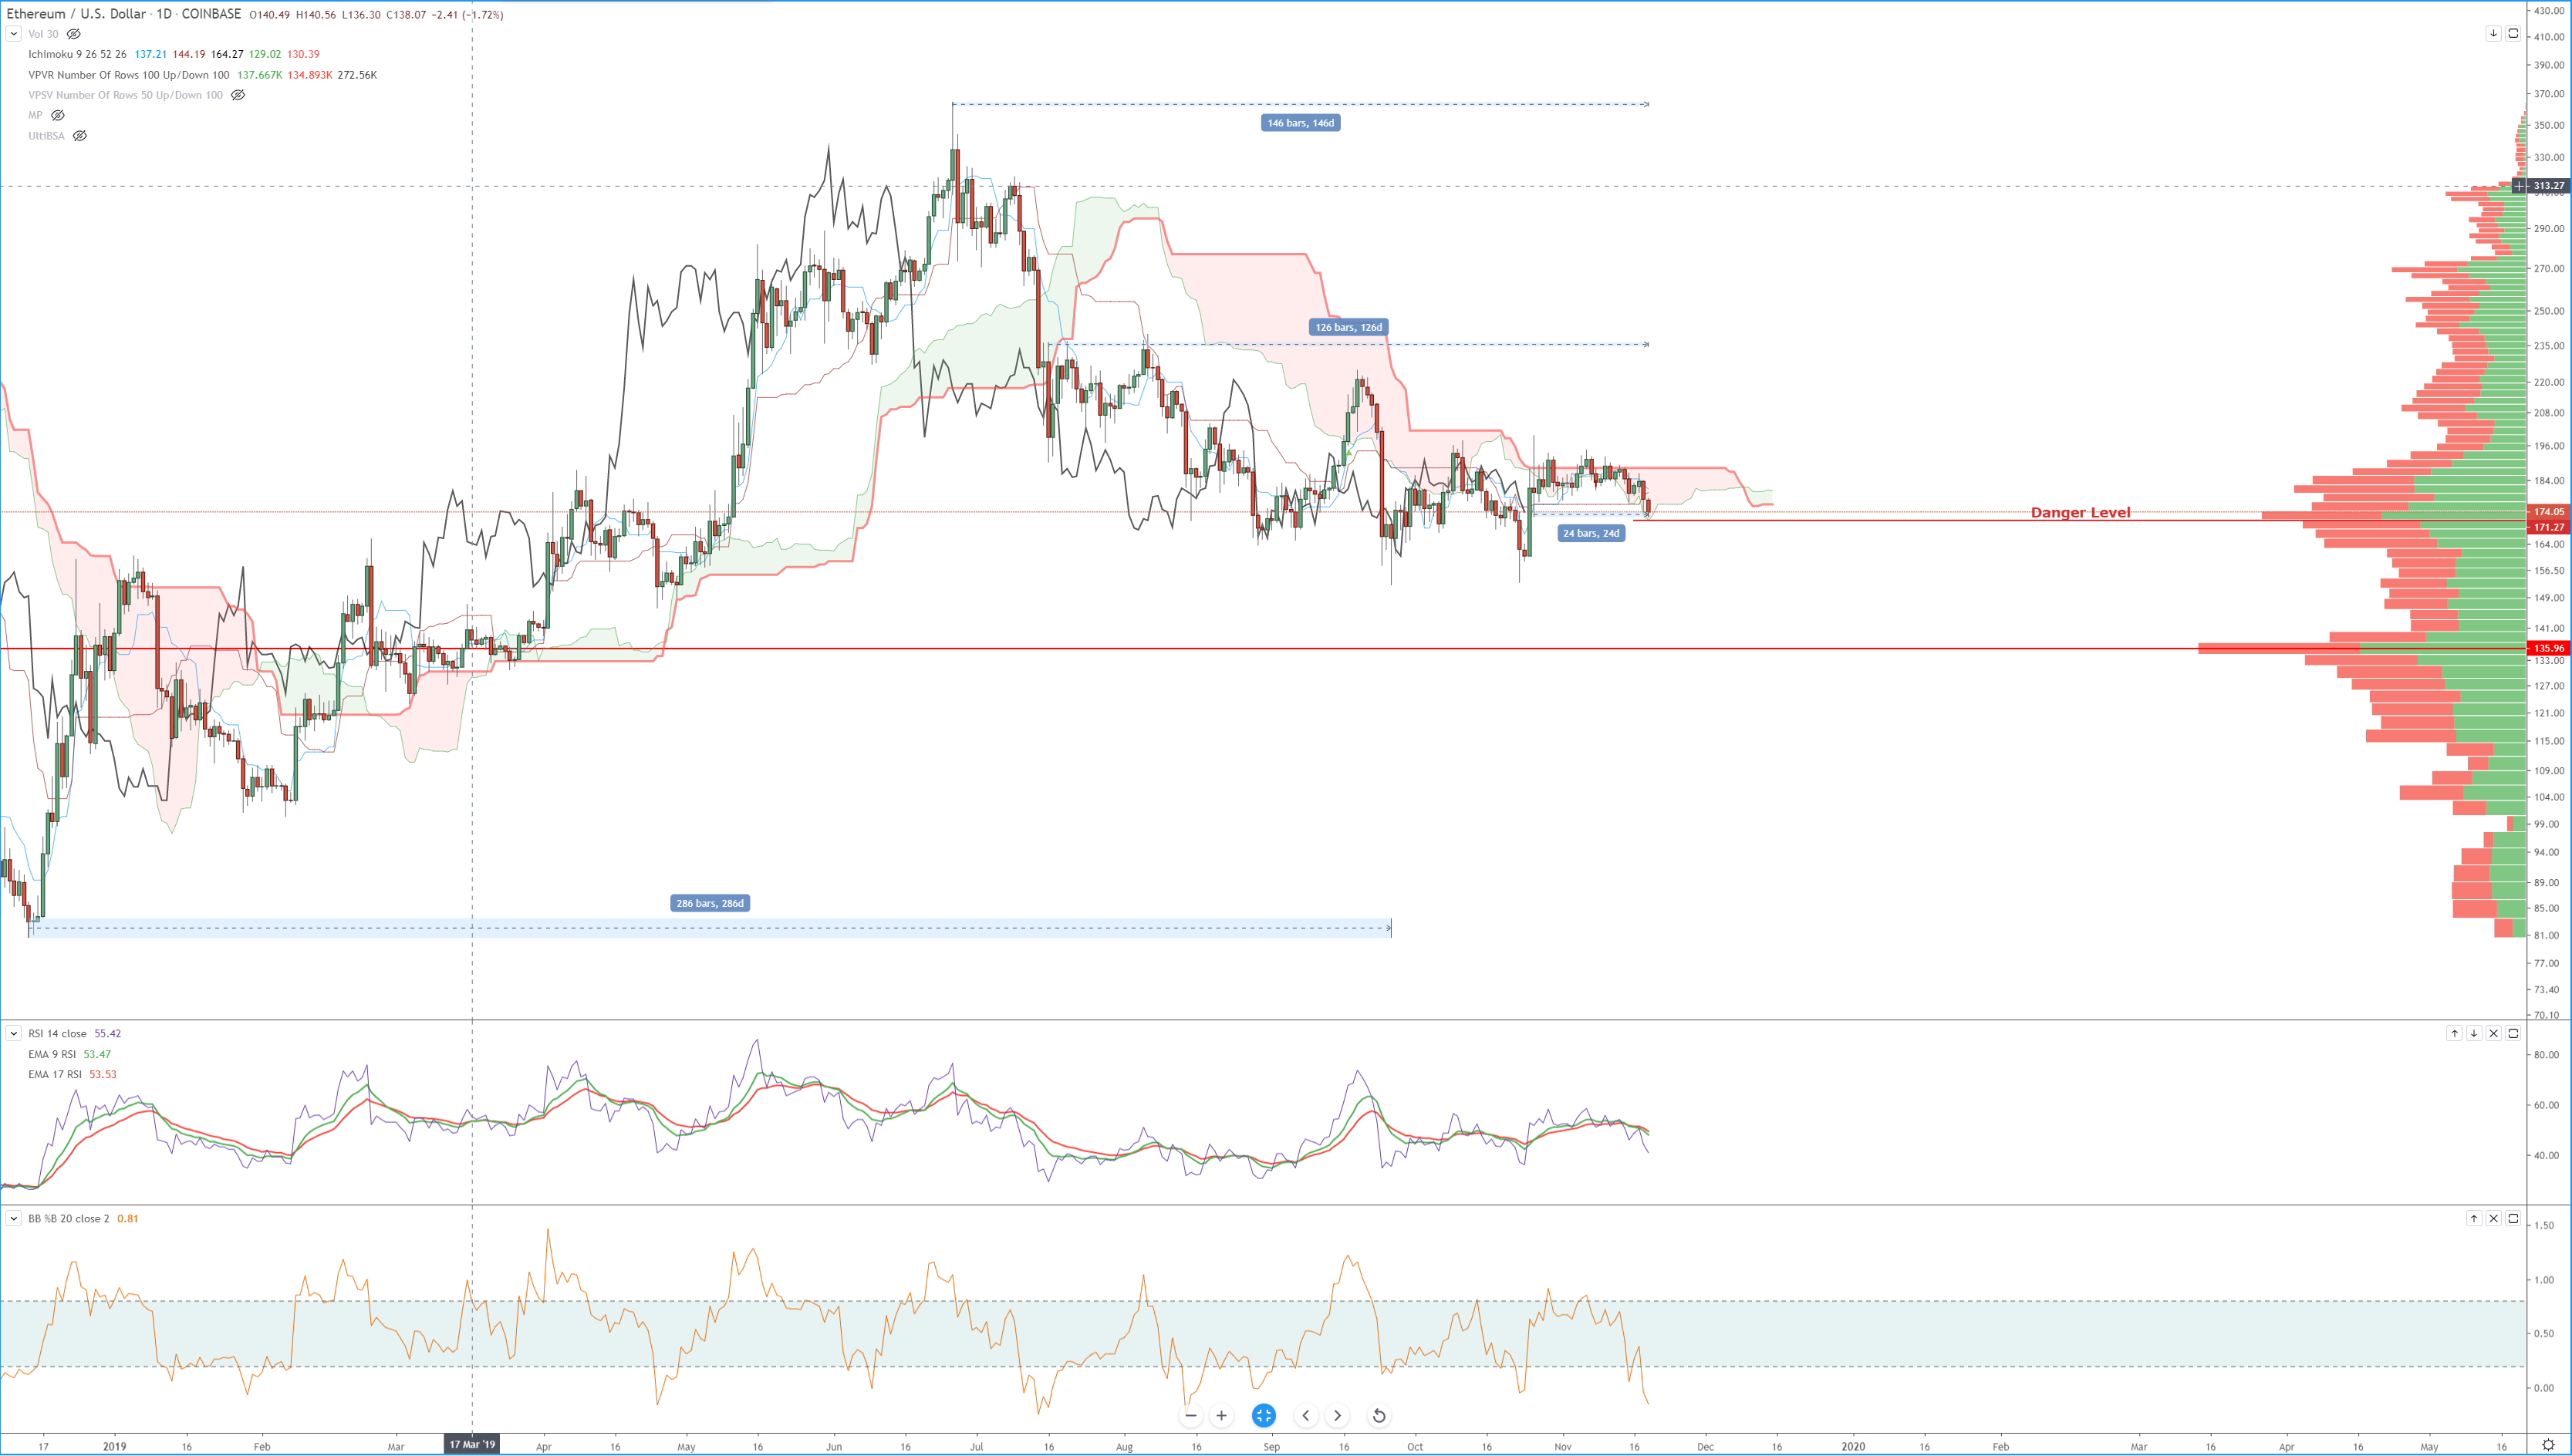
There are two key Gann levels that I want to point your attention to the 144-day cycle and the 120-day cycle. From the June 26th, 2019 high, the first day of Ethereum dropping below the Cloud on the daily chart (July 16th, 2019) brings us to today, which is 126-days from that June high. 126-days is well within the 120-day Gann wrote that the 120-day cycle usually occurs with the trend. He also wrote that it should be watched as a countertrend high if a low was found at 90-days (which there was). Some instruments follow 120-day and 250-day cycles, and some don’t. Today (November 11th, 2019) is 146-days from the June high and is also within an important Gann cycle, the 144-day period. The 144-day cycle is an extremely important one. Gann did not write much about this cycle – only that it can terminate movements and is generally misapplied by students of Gann.
Gann’s words about the 144-day cycle terminating movements are essential. When we consider the present value area that Ethereum is trading against, it becomes difficult to assume that prices will move higher from this value area. We should observe a resumption of the bull market that was started at the beginning of 2019 – but that is not a certainty — the volume profile on the right displays two key zones. The red horizontal line at $135.96 is the VPOC (Volume Point of Control) on Ethereum’s chart from the 2018 low to today. The horizontal line that reads ‘Danger Zone’ is the current high volume node that Ethereum is presently trading against. The exact bottom of that high volume node is also the break of the bottom of the Cloud. If price drops below $170, then we should anticipate a swift drive south to the VPOC at $135.96.
But let’s put things into perspective. The December 2018 low was also the bear market low: $80.60. Even if price were to drop down to $135.96 – a -62.66% drop – Ethereum would still print a gain of +68.64%. It is difficult for those involved with looking at a market day to day to remember the broader performance. A +68.64% increase in YoY is a dramatic and powerful bullish statement in anyone’s book. I look to the Fibonacci retracement levels as an important level to pay attention in conjunction with the levels in the Volume Profile. The 61.8% Fibonacci retracement (golden mean) is at $164.05. This is a strong support level that could see a rejection of lower moves. If it doesn’t hold as support, then the next important Fibonacci retracement level is the 78.6% level at $132.04. There are two very definite and powerful support levels represented by both volume and price, and we should expect any move here to be, more than likely, the last big move of 2019. What happens between November 20th and November 28th will likely set up the next big move for 2020.
See live prices and historical data on all the cryptocurrencies we track. Quick links to bitcoin, ethereum and litecoin.