Basic Attention Token (BAT) moves +7% higher during Friday’s trade.
Recent weekly candlesticks indicate strong buying pressure.
Strong Buying on Basic Attention Token’s (BAT) Weekly Charts
 Basic Attention Token (BTC) Weekly Chart
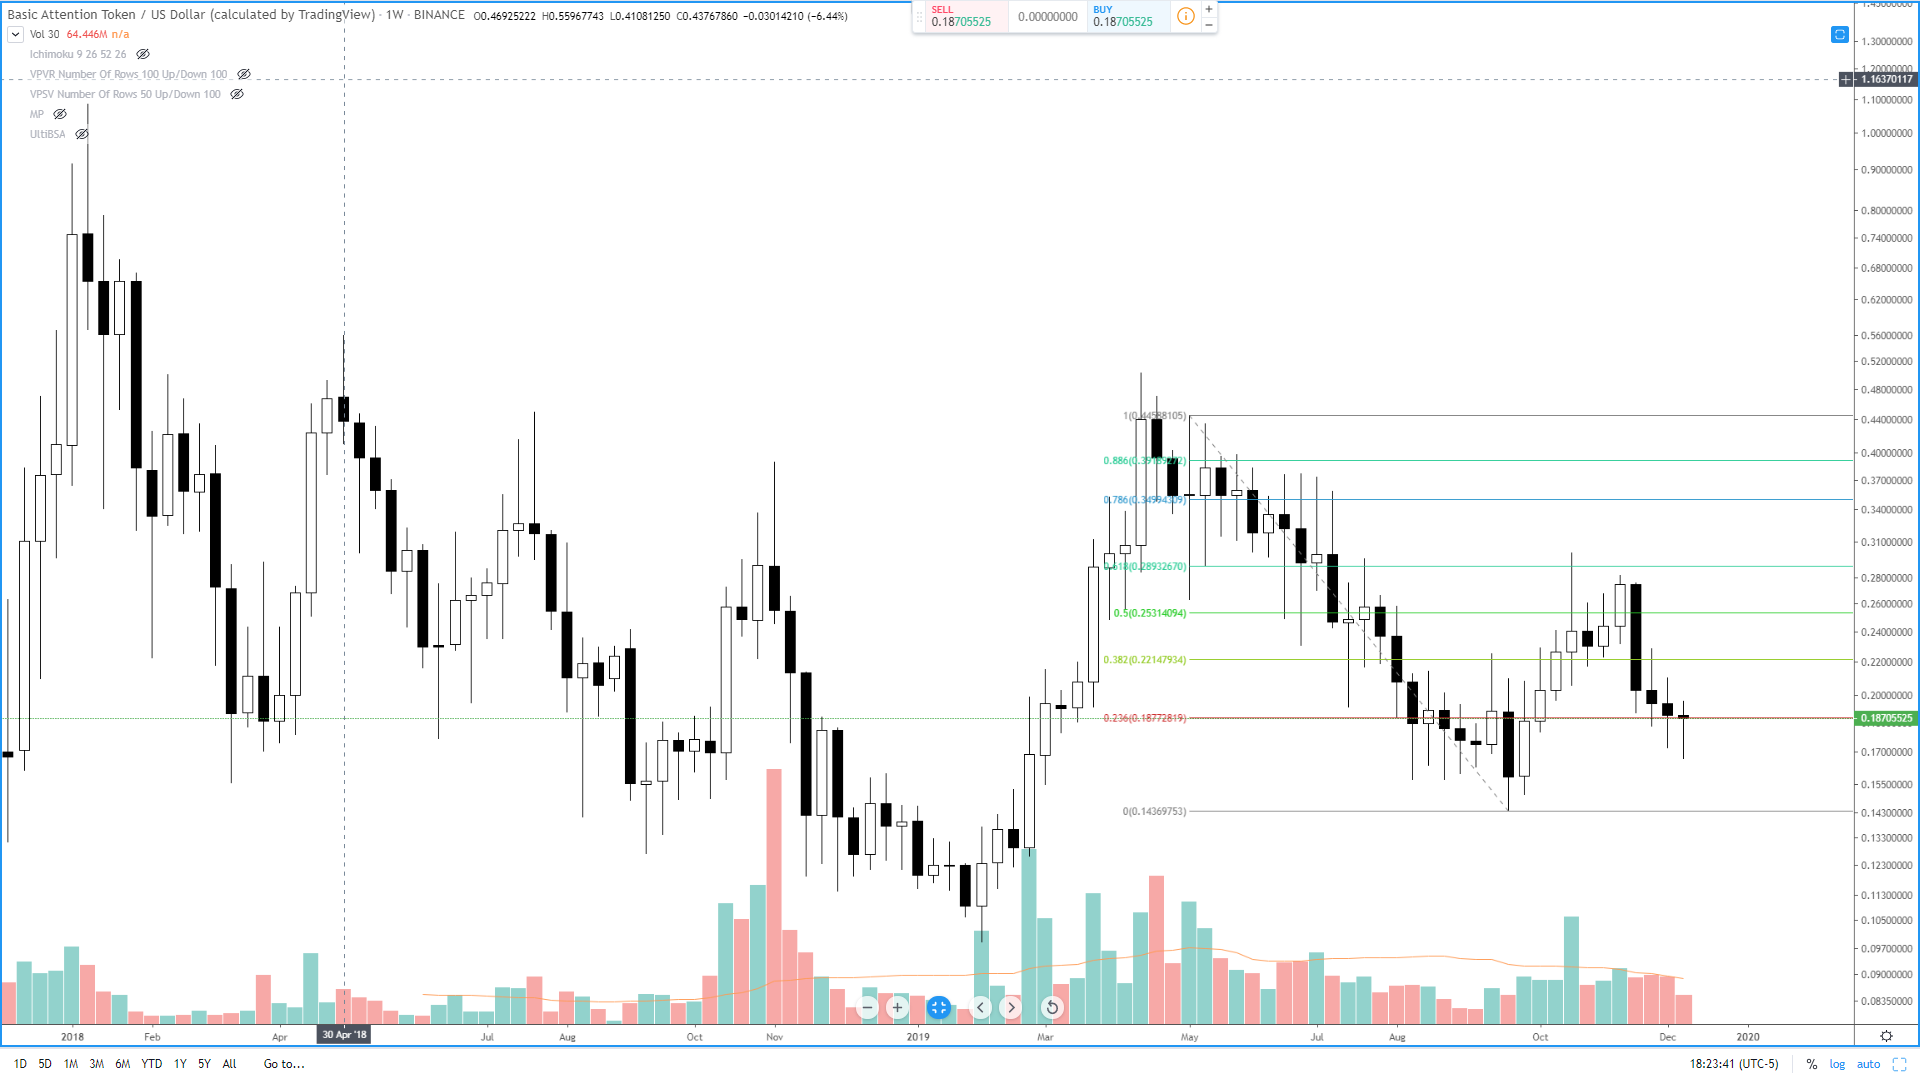
Basic Attention Token has been experiencing a very bullish run during Friday’s trading session. It has been one of the best performing altcoins on the Friday trade. More importantly, though, the weekly candlesticks have generated very important and influential patterns. Unless something changes between the current weekly candlestick, we will see Basic Attention Token create the third consecutive week of increasing lower wicks, but with strong buying pressure. Observe on the chart how last week’s and the current week’s bodies have very little space between the open and close. We can interpret the candlesticks to mean that bears have attempted to sell Basic Attention Token lower but have been thwarted by a larger number of buyers. The close of the last three weeks has not changed much, even though the ranges have increased lower each week. We should consider this to be a bullish sign that could indicate a reversal to the upside very shortly.
In the past four weeks, weekly candles have another shared relationship: the 23.6% Fibonacci retracement level. The current 23.6% Fibonacci retracement level comes from the retracement of the week of September 23rd, 2019 low of 0.1436 to the confirmation lower swing high of 0.4458 during the week of May 6th, 2019. The week of November 18th saw the low of that week find support against the 23.6% retracement level. The week of November 25th saw Basic Attention Token trade below the 23.6% retracement level but ultimately closed above it. And last week’s candlestick (December 2nd, 2019) also traded below the 23.6% Fibonacci retracement level - but moved back up and closed above that retracement level. The current weekly candlestick is trading slightly below the 23.6% Fibonacci retracement level, but we still have a little over two days for price to move above that retracement level to close above it.
The current weekly candlestick for Basic Attention Token could generate a powerful reversal candlestick pattern: a long-legged Doji. Longed legged Dojis are part of the overall Doji family. The long-legged Doji differs from the other Doji patterns in that a long-legged Doji has long wicks. Additionally, long-legged Dojis tend to appear near key changes in swings or trends. And the important level that this weekly long-legged Doji could form against is one of the most powerful cycles in Gann analysis: the 49-day cycle. The 49-day cycle is one that Gann called the death cycle. For whatever reason, when an instrument has been trading in a trend for 49-days (7 weeks), it often finds a swift reversal in the trend. The current weekly candlestick marks the seventh week since the most recent major swing high made during the week of October 21st, 2019. We could expect to see some significant changes in the direction of Basic Attention Token’s current price direction if we get a strong long-legged Doji to close this weekly candlestick.
See live prices and historical data on all the cryptocurrencies we track. Quick links to bitcoin, ethereum and litecoin.