Measurement of Resistance, Porosity, and Water Contact Angle of Porous Transport Layers for Low-Temperature Electrolysis Technologies
 Ryan J. Ouimet1*
  James L. Young2 Tobias Schuler2
  Guido Bender2
  George M. Roberts1 Katherine E. Ayers1
- 1Nel Hydrogen, Wallingford, CT, United States
- 2National Renewable Energy Laboratory, Golden, CO, United States
The porous transport layer is an important component of low-temperature electrolysis devices, such as proton exchange membrane water electrolyzers or anion exchange membrane water electrolyzers. PTLs have significant influence on the cell performance as their bulk resistance can impact the ohmic resistance, their contact resistance can impact electrode performance, and their structure can impact the liquid flow to the cell, which could cause mass-transport losses. In order to improve cell performance, optimization of the PTL is critical. Standardized protocols should be utilized to adequately compare PTLs being developed from different institutions. This method will detail a standardized protocol for measuring the resistance of the PTL using a four-wire setup and will also detail a process for measuring the porosity and water contact angle of the PTL using capillary flow porometry.
1 Introduction
Porous transport layers (PTLs) perform many important functions for low-temperature electrolysis technologies. PTLs distribute water to the entire active area of the cell, assist with the removal of product gases and heat away from the cell, apply even force across the active area, and act as a current collector (Majasan, et al., 2018). As a result of these functions, the PTL plays a role in the mass transport overpotentials and ohmic overpotentials that occur within proton exchange membrane water electrolyzers (PEMWEs) and anion exchange membrane water electrolyzers (AEMWEs).
Ohmic overpotentials have an increasingly detrimental effect on PEMWE cell performance as the current density is increased. The ohmic resistance associated with this overpotential is caused by ionic transport through the membrane, contact resistances, and bulk electrical resistances. While research has been ongoing to examine methods to reduce membrane thickness as a mechanism for reducing ohmic resistance, there has been little focus on studying the effect of contact resistance of cell components on ohmic resistance. Research by Liu et al. has examined the effect of reducing the ohmic resistance by sputter coating Ir onto a Ti PTL and observed an 81 mV performance improvement at 2 A cm−2 (Liu et al. 2018). In addition, research by Majasan et al. examined the effect of PTL porosity on cell performance and determined that reduction of mean PTL pore diameter led to less ohmic resistance at all measured current densities leading to the conclusion that contact resistance is a relevant factor in cell performance (Majasan, et al., 2018).
Mass transport overpotential is primarily caused by a lack of water interacting with the anode catalyst as well as the ineffective removal of product gases away from the catalyst surface. When operating at higher currents, more water is required and more gas is produced, which causes increased mass transport resistance and begins to limit efficient water splitting at those high current densities. In addition to porosity, it has been determined that the wettability of the PTL is important for understanding the two-phase flow through a PTL and its impact on mass transport resistance (Bromberger, et al., 2018). The wettability can be determined through the measurement of the contact angle of the internal pores of the PTL as proposed by Bromberger et al. by using capillary flow porometry.
Despite the importance of PTLs on the performance of low-temperature water electrolyzers, there has been significantly less research to study and optimize these components compared to similar studies on gas diffusion layers used for fuel cells (Ayers, et al., 2019). To advance and optimize PTLs for water electrolysis applications, additional studies and standardized methodologies are required. The method proposed here will provide researchers with a standardized protocol to examine the resistance, porosity, and water contact angle of PTLs to be used in low-temperature water electrolyzers. Using a four-wire resistance measurement method, researchers can examine how to further reduce ohmic losses related to the resistance of the PTLs. In addition, this protocol will utilize capillary flow porometry as a standardized method for measuring the porosity of the PTL.
2 Protocol Scope
2.1 Scope and Applicability
The purpose of this procedure is to determine the electrical bulk resistance of the porous transport layer (PTL) as well as the pore size distribution (PSD), mean flow pore diameter, and water contact angle of the PTL. This protocol assumes that the PTL being tested has uniform thickness and is defect-free.
2.2 Summary of Method
This protocol will utilize a potentiostat with four-wire measurements to determine the bulk resistance of the PTL. Following the resistance measurement, capillary flow porometry (CFP) will be performed on the PTL which will provide information on the porosity of the PTL. When using a wetting liquid with a low contact angle (such as POREFIL™ or Porofil™), the CFP will show the smallest pore, largest pore, and the mean flow pore of the PTL. When comparing CFP data from the low contact angle measurement to CFP data taken with deionized water as the wetting liquid, calculations can be made to determine the internal contact angle of the deionized water on the PTL.
2.3 Personnel Qualifications/Responsibilities
Users should have basic laboratory knowledge and experience. Users should be trained to use all equipment listed in Section 2.5. Users have the responsibility of ensuring that they have read through all pertinent SDS related to this protocol.
2.4 Health and Safety Warning
It is important to be aware of all hazards and thoroughly read through all safety data sheets (SDS) associated with this protocol. When performing the resistance measurement, a current will be momentarily passed through the test setup. Ensure that the area is dry and free of any shock hazards. Additionally, during the resistance test, the sample will be under compressive load (∼7 bar). Be aware that the lab press used during that test is a pinch hazard.
2.5 Equipment and Supplies
Resistance Measurements: Potentiostat arranged for four-wire resistance measurements or an accurate power supply (such as a Bio-Logic SP-300 potentiostat or a California Instruments AST1501 power supply), carbon gas diffusion layers, 2 pieces of gold-coated copper with tabs where the potentiostat leads can be attached, laboratory press, voltmeter for calibration (such as Keithley 2000).
Water Property Tests: Capillary flow porometer (such as POROMETER POROLUX™ 1,000, Anton Paar Porometer 3G, or similar), POREFIL™ or similar wetting fluid, deionized water.
2.6 Nomenclature and Definitions
Alkaline exchange membrane water electrolysis (AEMWE); capillary flow porometry (CFP); proton exchange membrane water electrolysis (PEMWE); pore size distribution (PSD); porous transport layer (PTL); safety data sheet (SDS).
2.7 Recommended Reading
In addition to the papers listed in the reference, the following journal articles are recommended for further understanding the concepts listed in this methods article as well as how these PTL properties impact cell performance:
• Gigac, Juraj, Monika Stankovska, and Maria Fiserova. 2017. “Comparison of Capillary Flow Porometry and Mercury Intrusion Porosimetry in Determination Pore Size Distribution of Papers.” Wood Research 587–596.
• Grigoriev, S.A., P. Millet, S.A. Volobuev, and V.N. Fateev. 2009. “Optimization of porous current collectors for PEM water electrolyzers.” International Journal of Hydrogen Energy 4,968–4,973.
• Ito, Hiroshi, Tetsuhiko Maeda, Akihiro Nakano, Atsushi Kato, and Tetsuya Yoshida. 2012. “Influence of pore structural properties of current collectors on the performance of proton exchange membrane electrolyzer.” Electrochimica Acta 242–248.
• Lickert, Thomas, Maximilian L. Kiermaier, Kolja Bromberger, Jagdishkumar Ghinaiya, Sebastian Metz, Arne Fallisch, and Tom Smolinka. 2020. “On the influence of the anodic porous transport layer on PEM electrolysis performance at high current densities.” International Journal of Hydrogen Energy 6,047–6,058.
3 Procedure
3.1 Step-By-Step Procedure
3.1.1 Resistance Measurements
1. Clean the as-received PTL prior to testing. One example of an acceptable cleaning procedure would be to first soak the PTL in isopropyl alcohol for 5 min. Rinse the PTL with a bottle of deionized water and then place the PTL in a beaker of boiling deionized water for 5 min. Remove the PTL and place it on a clean surface in an oven set to 75°C for 15 min to evaporate any remaining water.
2. Cut a piece of cleaned PTL to a dimension of 55 mm × 55 mm by using a cutting method that ensures a flat PTL sample such as a steel rule die, laser cutting, or shears. Ensure that the sample is flat, clean, and without defects.
3. Place the cleaned PTL between two pieces of carbon GDL material.
4. Place the GDL|PTL|GDL between two pieces of highly conductive metal, such as gold electroplated on copper or gold sputtered on copper. The Au-coated Cu should be of the same size or slightly larger than the PTL sample. Ensure that the Au-coated Cu pieces are not in physical contact of each other. One side of each Au-coated Cu plate should have an insulating layer applied. Ensure that the insulating layer is facing away from the GDL|PTL|GDL sample. If there is no insulating layer on the Au-coated Cu, electrically insulating plates must be placed between each Au-coated Cu plate and the laboratory press.
5. Place the Au-coated Cu|GDL|PTL|GDL|Au-coated Cu setup into a laboratory press so that the setup is centered in the press. The setup should be similar to what is shown in Figure 1.
6. Press the sample to 7 bar.
7. Once the sample is affixed in the press hardware, connect the positive voltage and current leads of the potentiostat to one of the Au-coated Cu plates and the negative voltage and current leads to the other Au-coated Cu plate. If the Au-coated Cu plates do not extend beyond the size of the press platens as shown in Figure 1, adjust the configuration by adding an additional current collector between the Au-coated Cu plates and insulating plates so that it is possible to ensure tight connection between the potentiostat and the test hardware. Take note of any modified setup.
8. Once at the proper pressure, use the potentiostat to apply a 0.5 A current across the sample and record the voltage. Increase the current in 0.5 A increments so that a total of 10 measurements are collected between 0.5 and 5 A.
9. Plot the voltage versus the current and obtain the slope of the linear regression of the collected data. The slope of the line will be the resistance of the PTL.
10. Repeat steps 8 and 9 an additional two times minimum to ensure the precision of the PTL resistance values obtained in step 9.
11. Once complete, remove the PTL and reassemble the Au-coated Cu|GDL|GDL|Au-coated Cu test setup.
12. Repeat the test again by pressing the test setup to 7 bar. Apply a 1 A current across the test setup and record the voltage. Increase the current in 0.5 A increments so that a total of 10 measurements are collected between 0.5 and 5 A.
13. Plot the voltage versus the current and obtain the slope of the linear regression of the collected data. The slope of the line will be the background test setup resistance.
14. Repeat steps 12 and 13 an additional two times minimum to ensure the precision of the background test setup resistance values obtained in step 13.
15. Subtract the average test setup resistance obtained in step 13 from the average of the overall resistance measured in step 9 to determine the bulk resistance of the PTL.
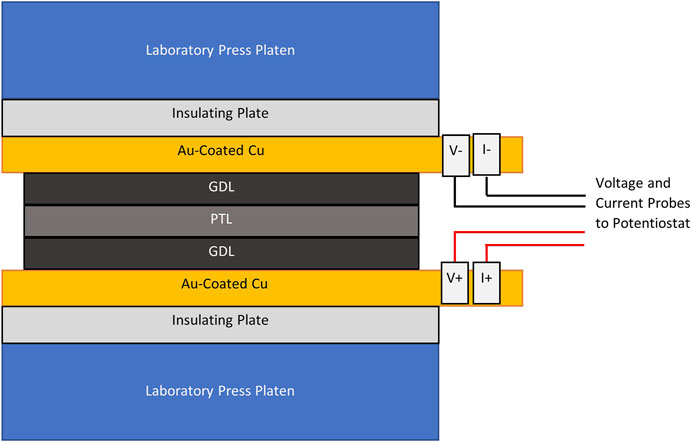
FIGURE 1. Test setup for the PTL resistance measurement.
3.1.2 Porosity and Water Contact Angle Measurements
1. Following the resistance measurements, cut out a piece of the PTL to a diameter of 50 mm.
2. Weigh the mass of the dry PTL sample
3. Place the dry PTL sample into the sample holder of the capillary flow porometer, place an o-ring over the edge of the sample, and tighten the sample holder until it is closed.
4. Run the porometer with the pressure kept constant for 20 s at each point to obtain stable data.
5. Following the collection of the dry curve data, immerse the PTL sample into a wetting liquid with a high wettability (ex. POREFIL™) so that the PTL sample is completely wet
6. Place the wet PTL sample into the sample holder of the capillary flow porometer, place an o-ring over the edge of the sample, and tighten the sample holder until it is closed.
7. Run the porometer with the pressure kept constant for 20 s at each point to obtain stable data
8. Following the collection of the wet curve data, in order to obtain the contact angle of water on the PTL surface, immerse the PTL sample into water in an ultrasonication bath. Sonicate the sample for 10 min or until the PTL is completely wet.
9. Place the wet PTL sample into the sample holder of the capillary flow porometer, place an o-ring over the edge of the sample, and tighten the sample holder until it is closed.
10. Run the porometer with the pressure kept constant for 20 s at each point to obtain stable data
11. Following the collection of the wet curve data, run the porometer again with the dry sample to obtain the dry curve.
3.2 Sample Preparation and Analysis
The PTL sample should be prepped to 55 mm × 55 mm prior to the resistance measurement. Once cut, the sample should be flat and free of cracks or defects. Similarly, the sample should be cut to be a round disk with a 50 mm diameter prior to the CFP measurements. The sample should be flat and free of cracks or defects after the cutting step.
3.3 Sample Handling and Preservation
After cleaning and prior to testing, the samples should be kept in a sterile container to ensure that no dust or foreign object debris contaminates the pores of the PTL. Handle with clean gloves to prevent contamination of the PTL.
3.4 Computer Hardware and Software
Software for the potentiostat should be provided by the potentiostat manufacturer. Software for the CFP hardware should be provided by the CFP manufacturer.
3.5 Data Collection, Analysis, and Records Management
Record PTL dimensions prior to testing. During the resistance testing, record the potentiostat current and voltage readings. During the CFP tests, record the weight of the PTL before and after testing. Be sure to have all data recorded in a lab notebook and/or electronically.
4 Results
For the PTL resistance measurements, the resistance would be calculated using Ohm’s law. With the current, I, set on the potentiostat, and the voltage, V, measured on the potentiostat, the resistance, R, can be calculated as:
Using Ohm’s law and the data collected in the resistance measurement protocol, a plot can be generated with the voltage on the y-axis and the current on the x-axis. The slope of the linear regression will be the combined resistance of the PTL and the test setup. In order to extract the PTL resistance, the resistance of the test setup without the PTL sample must also be measured using the same method. Once the resistance of the test setup with the PTL, Rsetup+PTL, is known along with the resistance of just the test setup, Rsetup, then the PTL bulk resistance can be calculated as:
The CFP data should be plotted with the gas flow rate vs pressure as shown in Figure 2 from Bromberger et al. (Bromberger, et al., 2018) Three curves should be plotted: the wet curve, dry curve, and half-dry curve. While the wet curve and dry curve is plotted from data collected by the CFP, the half-dry curve is typically calculated and plotted by the CFP software. The half-dry curve is calculated as being equal to one half of the gas flow rate of the dry curve at a given pressure. When examining the plot, the intersection of the dry curve and wet curve indicates the smallest pore in the PTL. The first bubble point on the wet curve indicates the largest pore in the PTL. The intersection of the wet curve and the half-dry curve is the mean flow pore of the PTL.
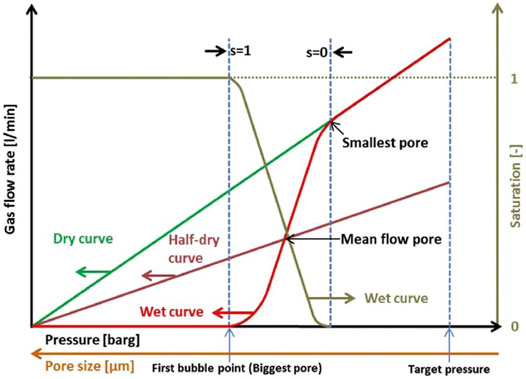
FIGURE 2. An example of a wet curve, dry curve, and half-dry curve obtained by capillary flow porometry. Reproduced with permission from Bromberger et al.
The pore diameter as a given pressure can be determined by:
In this equation, d is the characteristic pore size (in m), B is the capillary constant, γ is the surface tension (in N/m), θ is the contact angle of the wetting liquid (in degrees), and p is the pressure (in Pa).
To calculate the contact angle of the water on the surface of the PTL, a specific pore diameter is examined and the equation above can be compared between the POROFIL™ CFP data and the water CFP data as:
where the w subscript is related to the water data while the p subscript is related to the POROFIL™ data. With θp = 0°, the equation above can be rewritten as:
5 Quality Control and Quality Assurance Section
The potentiostat and the CFP hardware should be calibrated annually according to the manufacturers’ specified calibration standards and procedures. All data should be properly and securely logged to ensure repeatability and consistency among tests.
5.1 Instrument or Method Calibration and Standardization
When operating the potentiostat for the resistance measurements, it is recommended to use a voltmeter that has been calibrated to 10–4 V or better to ensure that the voltage being measured between the sense leads is accurate. Additionally, the resistance of the GDL material should be obtained prior to measuring the resistance of the PTL sample. If the resistance of the GDL is not negligible, it should be subtracted from the PTL resistance measurements to have a more accurate PTL resistance value. The CFP should be calibrated against a standard material annually. Check with the porometer manufacturer for recommended calibration standards and procedures.
5.2 Cautions
When handling the PTL, be sure to keep the PTL clean and avoid contamination. The introduction of foreign object debris to the PTL may result in higher resistance and could negatively impact the water properties of the PTL. Also, be sure not to introduce any bends or cracks into the PTL as that may also result in higher resistance.
5.3 Common Issues
While performing the experiments listed above, there are a few areas where common issues may occur. All PTL samples, as well as other materials used in this study, should be cleaned. If there are any contaminants on the Au-coated Cu plate, GDL, or PTL during the resistance measurements, the contaminant could cause the measured ohmic resistance to be higher than anticipated. When pressing the Au-coated Cu|GDL|PTL|GDL|Au-coated Cu, be sure to limit the applied force to within ±5% error. Research by Vikram et al. shows the impact of compression pressure on measured resistance and demonstrates how important it is to be as close as possible to the targeted compression pressure listed in the procedure (Vikram, et al., 2016).
During the porosity and water contact angle measurements, it is important to ensure that the sample is completely dry before testing and that there are no contaminants on the scale prior to weighing the PTL sample. It may be helpful to wipe the surface of the scale with acetone to ensure the scale is clean prior to weighing the sample. Lastly, when the PTL is to be submerged and wet with water prior to capillary flow porometry testing, be aware that it is difficult to ensure that the sample is completely wet as water may have difficulty wetting interior pores of the PTL. Use ultrasonication or any additional precautions to ensure that the sample is properly wetted prior to the capillary flow porometry measurements.
5.4 Interferences
The instrumentation used for this protocol should be calibrated prior to testing to ensure the accuracy of these tests. If pores are not completely wetted prior to CFP experiments, data may be inaccurate or incomplete.
5.5 Troubleshooting
To ensure the accuracy of the potentiostat during the resistance measurements, a calibrated multimeter can be used to measure the voltage across the sample which can be compared to the potentiostat measurements. If the voltage readings are different, additional troubleshooting of the potentiostat may be required to ensure accuracy.
5.6 Error Analysis
When collecting resistance measurements, it is recommended to obtain multiple measurements at the same location to ensure the accuracy and repeatability of the measurement. Following the data collection, the measured resistance should be reported as an average of all collected measurements at that point (
When collecting the capillary flow porometry data, error should be based upon the instrument error obtained during calibration. Multiple tests should be performed to ensure that the porosity results are repeatable and precise.
6 Discussion
Resistance data collected with this protocol should be replicable and comparable to other similar data in literature. If the method is being used to examine the effect of PTL porosity on the resistance, the resistance should be plotted versus the porosity and that data should be compared to other existing literature to ensure accuracy or novelty of the obtained results. Similarly, if the method is being used to examine the effect of the compression pressure acting on the PTL, a plot of the resistance vs compression pressure should be plotted and compared to similar literature, such as Vikram et al.
When collecting the capillary flow porometry data, the obtained dry, wet, and half-wet curves should be plotted vs the applied pressure of the porometer. This data can then be analyzed as described in the Results section and compared to literature sources, such as Bromberger et al. Using the porosity data obtained by the CFP measurements, the data can then be compared to literature sources for similar PTL materials to ensure the accuracy of the obtained data.
Data Availability Statement
The original contributions presented in the study are included in the article/supplementary material, further inquiries can be directed to the corresponding author.
Author Contributions
RO wrote the first draft of the manuscript. RO, JY, TS, GB, and KA all contributed to the manuscript revision. GR and KA supervised and assisted with the manuscript development.
Funding
This work was funded by the United States Department of Energy under the program “Benchmarking Advanced Water Splitting Technologies: Best Practices in Materials Characterization” (Award #: DE-EE0008092).
Conflict of Interest
Authors RO, GR and KA were employed by Nel Hydrogen.
The remaining authors declare that the research was conducted in the absence of any commercial or financial relationships that could be construed as a potential conflict of interest.
Publisher’s Note
All claims expressed in this article are solely those of the authors and do not necessarily represent those of their affiliated organizations, or those of the publisher, the editors and the reviewers. Any product that may be evaluated in this article, or claim that may be made by its manufacturer, is not guaranteed or endorsed by the publisher.
Acknowledgments
The authors would like to acknowledge the U.S. Department of Energy and the funding support from project DOE-DE-EE0008092, “Benchmarking Advanced Water Splitting Technologies: Best Practices in Materials Characterization”.
References
Ayers, K., Danilovic, N., Ouimet, R., Carmo, M., Pivovar, B., and Bornstein, M. (2019). Perspectives on Low-Temperature Electrolysis and Potential for Renewable Hydrogen at Scale. Annu. Rev. Chem. Biomol. Eng. 10, 219–239. doi:10.1146/annurev-chembioeng-060718-030241
Bromberger, K., Ghinaiya, J., Lickert, T., Fallisch, A., and Smolinka, T. (2018). Hydraulic Ex Situ Through-Plane Characterization of Porous Transport Layers in PEM Water Electrolysis Cells. Int. J. Hydrogen Energy 43, 2556–2569. doi:10.1016/j.ijhydene.2017.12.042
Liu, C., Carmo, M., Bender, G., Everwand, A., Lickert, T., Young, J. L., et al. (2018). Performance Enhancement of PEM Electrolyzers through Iridium-Coated Titanium Porous Transport Layers. Electrochem. Commun. 97, 96–99. doi:10.1016/j.elecom.2018.10.021
Majasan, J. O., Iacoviello, F., Shearing, P. R., and Brett, D. J. (2018). Effect of Microstructure of Porous Transport Layer on Performance in Polymer Electrolyte Membrane Water Electrolyser. Energy Procedia 151, 111–119. doi:10.1016/j.egypro.2018.09.035
Keywords: contact angle, porosity, porous transport layer, resistance, proton exchange membrane based water electrolysis
Citation: Ouimet RJ, Young JL, Schuler T, Bender G, Roberts GM and Ayers KE (2022) Measurement of Resistance, Porosity, and Water Contact Angle of Porous Transport Layers for Low-Temperature Electrolysis Technologies. Front. Energy Res. 10:911077. doi: 10.3389/fenrg.2022.911077
Received: 01 April 2022; Accepted: 13 May 2022;
Published: 31 May 2022.
Edited by:
Olga A Marina, Pacific Northwest National Laboratory (DOE), United StatesReviewed by:
Aniruddha Pramod Kulkarni, Cavendish Renewable Technology, AustraliaTatyana V. Reshetenko, University of Hawaii at Manoa, United States
Copyright © 2022 Ouimet, Young, Schuler, Bender, Roberts and Ayers. This is an open-access article distributed under the terms of the Creative Commons Attribution License (CC BY). The use, distribution or reproduction in other forums is permitted, provided the original author(s) and the copyright owner(s) are credited and that the original publication in this journal is cited, in accordance with accepted academic practice. No use, distribution or reproduction is permitted which does not comply with these terms.
*Correspondence: Ryan J. Ouimet, rouimet@nelhydrogen.com