![]() Rajarshi Mitra
Rajarshi Mitra
Independent Analyst
- Bitcoin "Fear and Greed" has moved from Neutral to Fear, showing that investors are panicking post-halving.
- ETH/BTC bulls are in control for the second straight day.
Bitcoin Fear and Greed Index
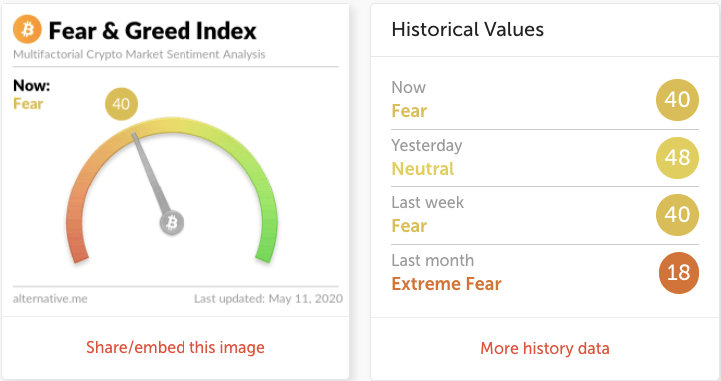
Alternative.me's Bitcoin fear and greed index has dropped from the “Neutral” to the “Fear” territory at 40. It looks like there is a bit of a panic among the investors post-halving.
ETH/BTC daily chart
-637248442355575914.png)
ETH/BTC bulls retained control for the second straight day as it went up from 0.021692 to 0.021715. This Monday, the bulls managed to take back ETH/BTC above the SMA 200. The MACD shows decreasing bearish momentum, while the RSI is trending at the edge of the oversold zone.
The bulls will need to conquer resistance at 0.02202 and 0.02252. On the downside, they will need to defend support levels at 0.0213 and 0.0207
BTC/USD daily chart
-637248442876671803.png)
BTC/USD went up from $8,672.65 to $8,591.58 as buyers try to take control post-halving. The price is trending above the red Ichimoku cloud. The Elliott Oscillator has had two red sessions in a row, while the MACD shows a reversal of bullish momentum. Both these indicators hint that the overall market sentiment is bearish.
On the downside, the buyers must defend the $8,390 and $8,125 support levels. On the upside, there are two strong resistance levels at $8,829.50 and $9,181.45.
ETH/USD daily chart
-637248444144519313.png)
ETH/USD went up from $185.82 to $186.42 as the buyers took control after four consecutive bearish days. The price is trending above the SMA 200 and SMA 50 curves, which are on the verge of crossing over to form the golden cross pattern.
The 20-day Bollinger jaw is narrowing, which shows decreasing price volatility. The William’s %R is still trending inside the oversold zone, indicating that the asset is undervalued and will go up more.
Bulls must aim for resistance levels at $196.70 and $207 to change market sentiment from bearish to bullish. On the downside, healthy support lies at $180.20 and $173.15.
XRP/USD daily chart
-637248444964991597.png)
XRP/USD bears stayed in control for the fourth straight day as the price went down from $0.1926 to $0.1917 in the early hours of Tuesday. The buyers face immediate resistance at the SMA 50 curve. The MACD shows increasing bearish momentum.
The bears will be aiming for the support levels at $0.1883 and $0.1812. On the upside, there are two strong resistance levels to be conquered at $0.1987 and $0.2115.
Note: All information on this page is subject to change. The use of this website constitutes acceptance of our user agreement. Please read our privacy policy and legal disclaimer. Opinions expressed at FXstreet.com are those of the individual authors and do not necessarily represent the opinion of FXstreet.com or its management. Risk Disclosure: Trading foreign exchange on margin carries a high level of risk, and may not be suitable for all investors. The high degree of leverage can work against you as well as for you. Before deciding to invest in foreign exchange you should carefully consider your investment objectives, level of experience, and risk appetite. The possibility exists that you could sustain a loss of some or all of your initial investment and therefore you should not invest money that you cannot afford to lose. You should be aware of all the risks associated with foreign exchange trading, and seek advice from an independent financial advisor if you have any doubts.
Recommended Content
Editors’ Picks
Ripple wipes out weekly gains, experts comment on role of Ripple stablecoin

Ripple declined to $0.52 on Thursday, erasing all gains registered earlier this week. Ripple SVP Eric van Miltenburg’s comments on the firm’s stablecoin, and how it is expected to benefit the XRP Ledger and native token XRP have raised concerns among crypto experts.
Hedera HBAR slips nearly 10% after air is cleared on mistaken link with giant BlackRock
HBAR price is down nearly 10% on Thursday, partly erasing gains inspired by the misinterpreted link with BlackRock. Despite the recent correction, Hedera’s price is up 44% in the past seven days.
The reason behind Bonk’s 105% rise and if you should buy now Premium

Bonk price has shot up 105% in the past five weeks. A retracement into $0.0000216 or the $0.0000152 to $0.0000186 imbalance would be a good buying opportunity. Patient investors can expect double-digit gains from BONK that could extend up to 70%.
Injective price weakness persists despite over 5.9 million INJ tokens burned
Injective price is trading with a bearish bias, stuck in the lower section of the market range. The bearish outlook abounds despite the network's deflationary efforts to pump the price. Coupled with broader market gloom, INJ token’s doomed days may not be over yet.
Bitcoin: BTC post-halving rally could be partially priced in Premium

Bitcoin (BTC) price briefly slipped below the $60,000 level for the last three days, attracting buyers in this area as the fourth BTC halving is due in a few hours. Is the halving priced in for Bitcoin? Or will the pioneer crypto note more gains in the coming days?