Both Cardano (ADA) and ChainLink (LINK) are very close to buy signals that would indicate a powerful upwards move is imminent.
Cardano (ADA)
 Cardano (ADA)
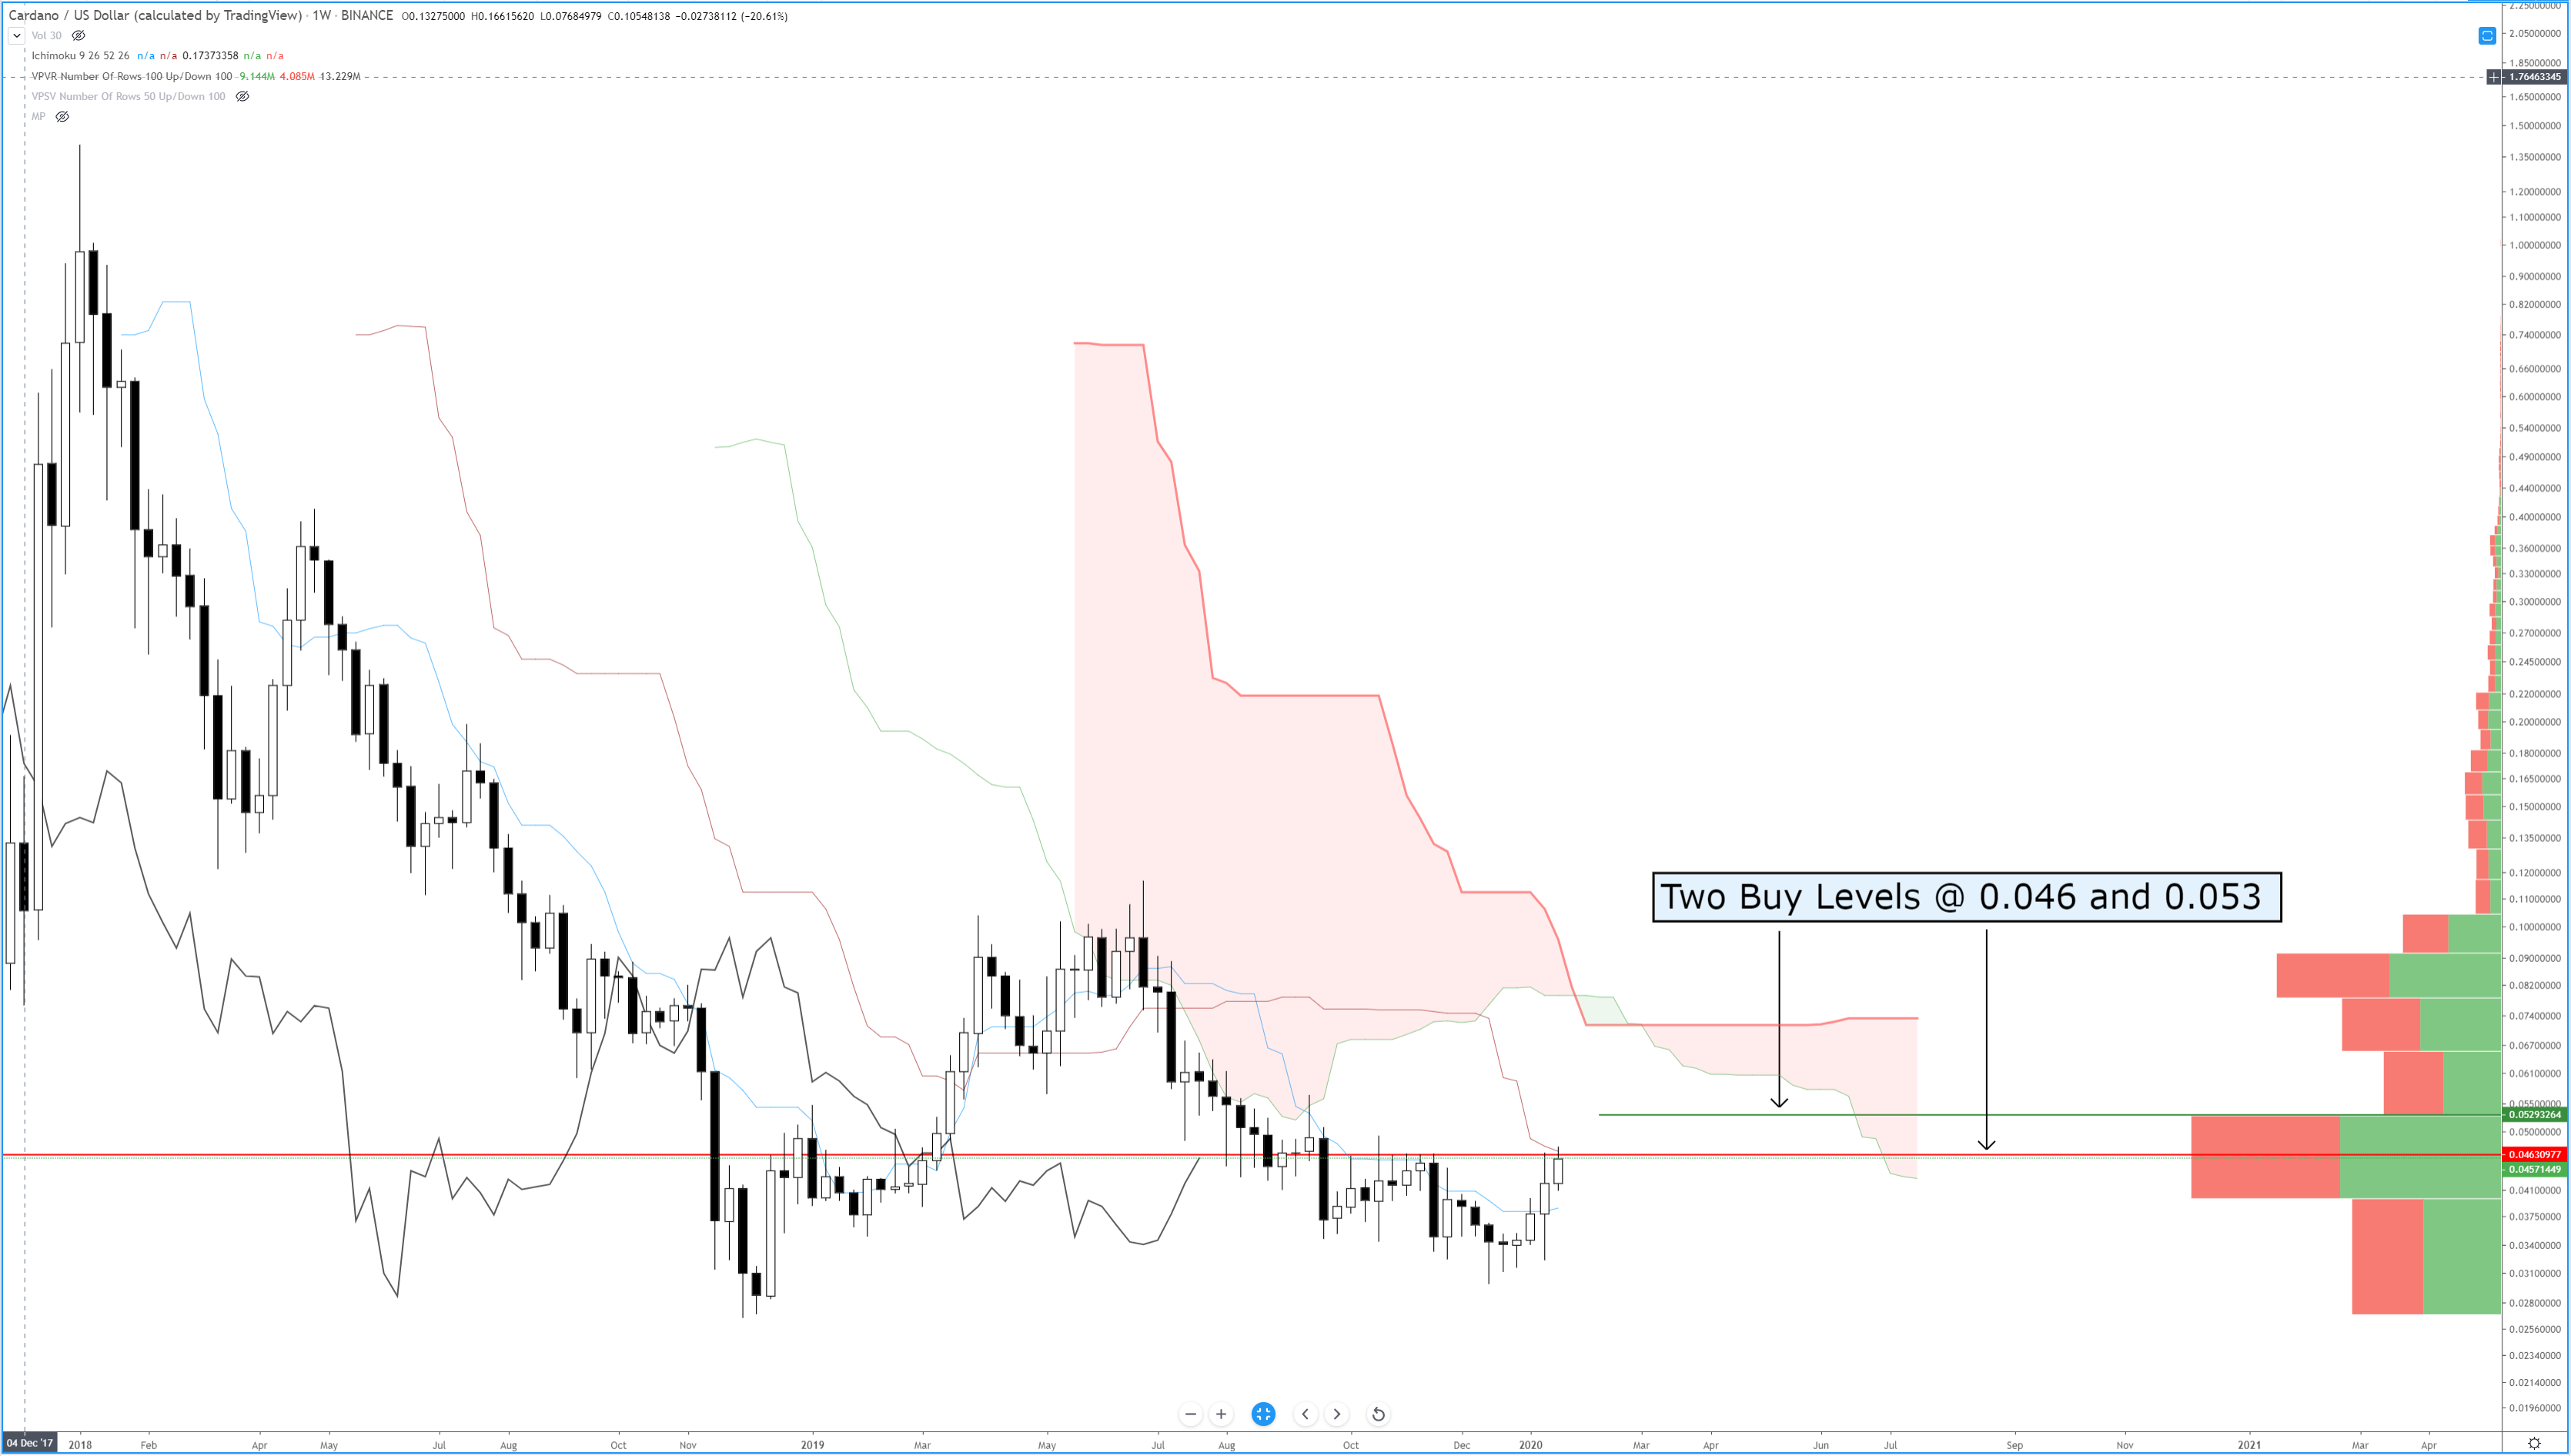
For Cardano’s (ADA) analysis, I am utilizing the weekly chart to identify two areas that I intend to enter and add to my current long positions. The chart above represents the entire trading history for Cardano. What I find most compelling about this chart is not the very bullish performance of the past three weeks (+25% gain), but it’s the current price level that is acting as a significant source of resistance. The red horizontal line on the chart represents the VPOC (Volume Point Of Control). The VPOC represents the price level where the most Cardano has traded at a particular price level. The VPOC is often one of the most challenging levels for price to move above or below. The resistance that bulls are facing is exacerbated by the presence of the weekly Kijun-Sen sharing the value area of the VPOC. If Cardano can break above the VPOC and the Kijun-Sen, I have one buy signal that will trigger. The second buy signal occurs when the current high-volume node is broken. If you look at the horizontal rows on the right, you will see that the longest of all the rows is where Cardano is currently trading in. High volume nodes represent areas of equilibrium and when price breaks a high volume node, it will typically have an explosive move in the direction of the break until it hits another high volume node. For Cardano, the entry above the high volume node at 0.052 would mean a roughly +50% gain to the next high volume node at 0.08.
Buy Signal @ 0.052
Buy Signal @ 0.047
ChainLink (LINK)
 ChainLink (LINK)
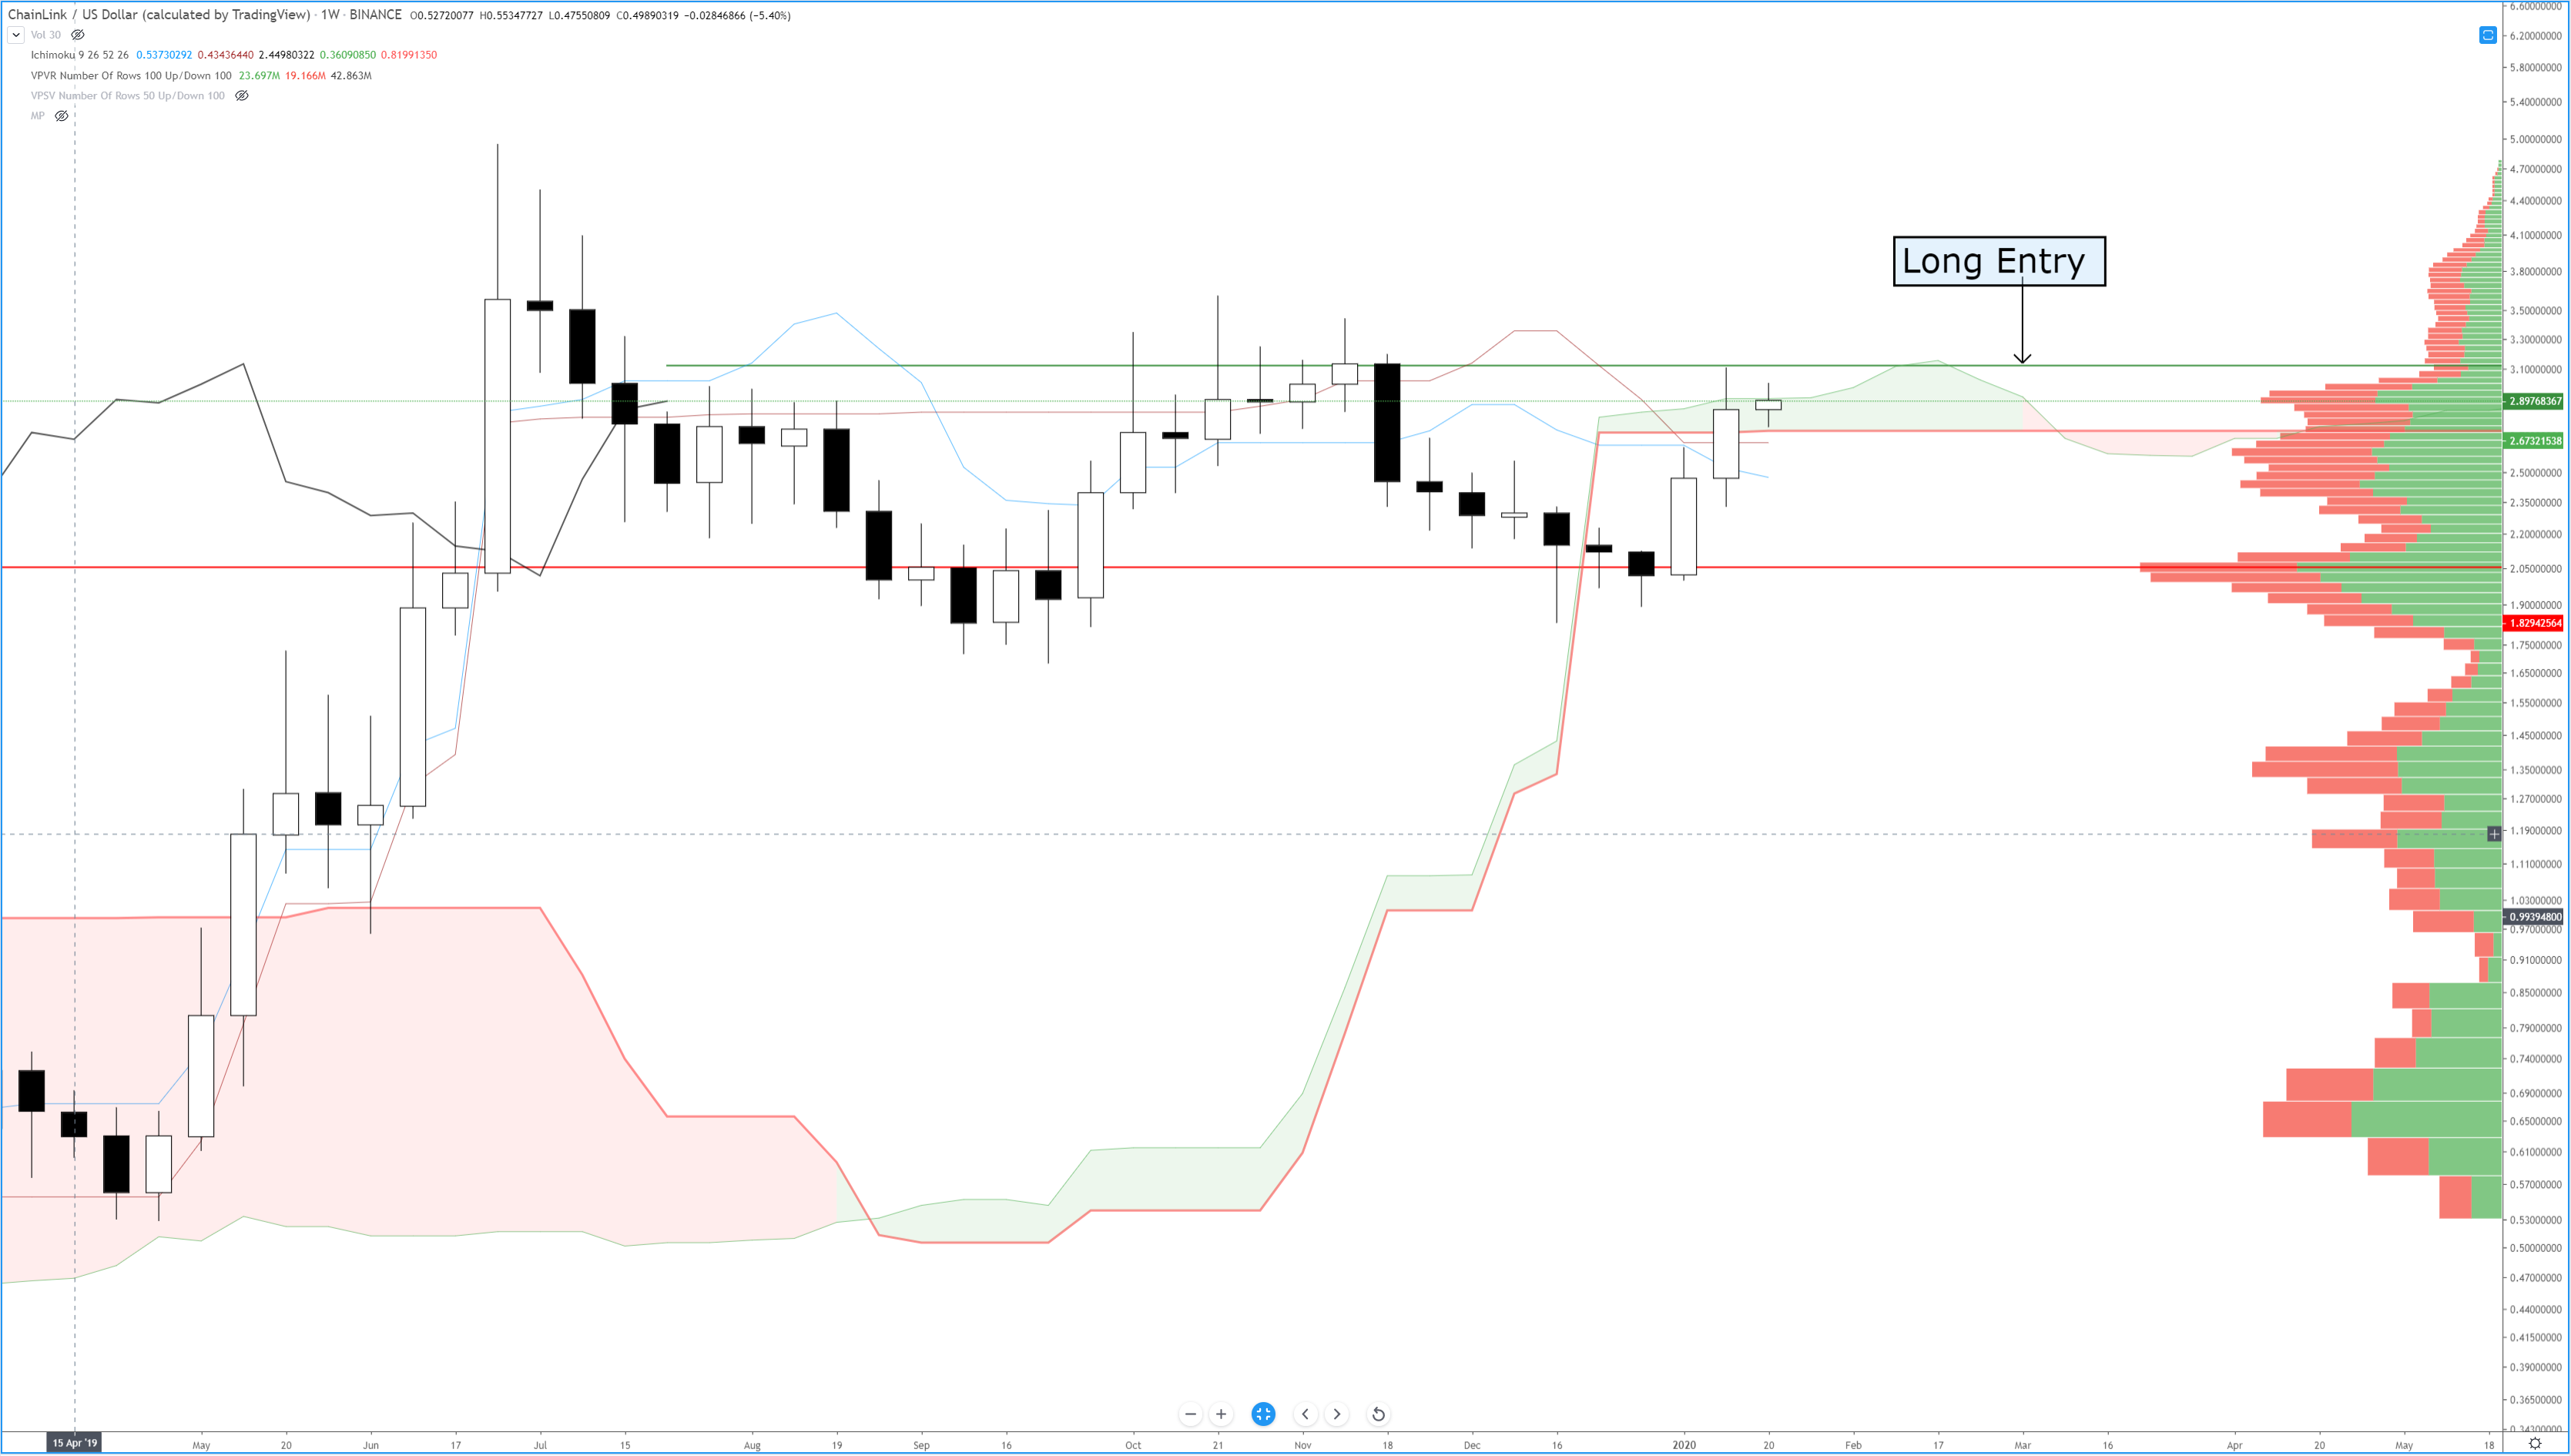
ChainLink (LINK) has been one of the clear leaders in the cryptocurrency sphere. It not only has outperformed the entire altcoin market, but it has exceeded even Bitcoin at various times. There is evident participation in this market to keep ChainLink at these higher values. I am already long on ChainLink, but I want to add to my position. However, I am only adding to my position once strength and a new up move have begun. The fact that we are trading higher and back above the bottom fo the Cloud (Senkou Span B) is a substantial positive for ChainLink. In many ways, ChainLink’s weekly Ichimoku chart looks a lot like Bitcoin’s current does. I am a buy signal for the 2.89 value area. There are two primary reasons why I am waiting for ChainLink to reach that level. First, that would put ChainLink above the Cloud and the high of last week. Second, and most importantly, the Chikou Span would be above the candlesticks and be in open space. The open space concept is a discovery made by Manesh Patel in his book, Trading with Ichimoku Cloud: The Essential Guide to Ichimoku Kinko Hyo Analysis. Open space means that the Chikou Span won’t horizontally intercept any future candlesticks over the next five to ten periods. What this indicates is a sort of ‘free movement’ higher with little no resistance ahead. It is one of the most bullish conditions that any Ichimoku chart could display. ChainLink is very close to creating on the single most bullish cryptocurrency charts in the entire cryptocurrency market.
Buy Signal @ 2.89
I am long Bitcoin (BTC), Cardano (ADA), and ChainLink (LINK)