- Significant number of altcoins creating major high volume nodes near their historic lows.
- Volume At Price Analysis gives us an early look at which coins may move higher first.
Volume At Price (VAP) Analysis
Volume At Price Analysis is a form of volume analysis that shows how much of something was traded at a particular price. This is different from what we know as normal volume analysis that measures how much of something was traded during a particular time. Volume At Price analysis is shown with horizontally versus vertically. Rows that ‘stick out’ more than others are known as HVNs, or high volume nodes. These nodes create very specials and powerful level of support and resistance. When there is a significant amount of ‘space’ between one high volume node to another, the theory is that price gets ‘sucked’ into and through that space like a vacuum before stopping at the next high volume node. It is also important to observe, especially at important highs and lows, if there is a new high volume node developing. In the case of some altcoins, their Bitcoin pairs are displaying new high volume nodes at these historical swing lows on their charts. To me, these are excellent buying opportunities.
Cardano (ADABTC)
 Cardano Volume Profile
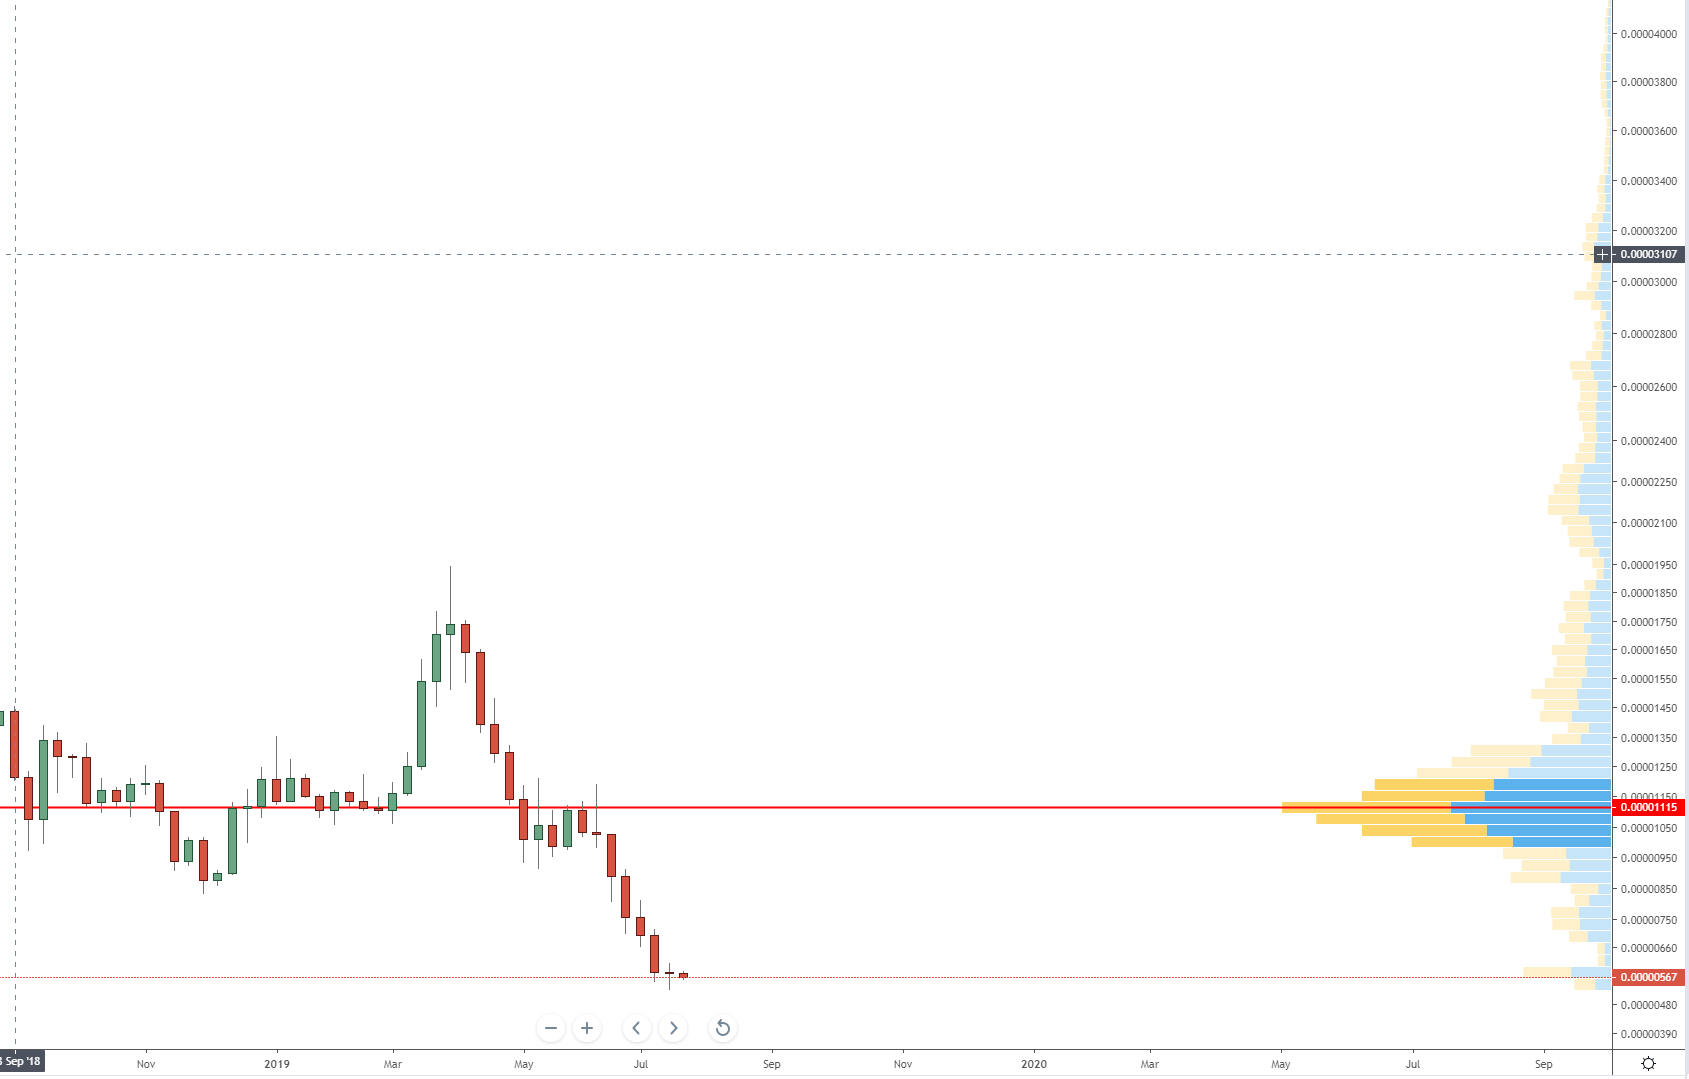
Cardano has been establishing a very strong and quickly formed a high volume node at these all-time lows. The important value area is between 560 and 600 sats. There are two zones that I see price moving through before facing its first major resistance. The first is at 750 and then again at 890 before price gets to the POC (Point of Control) at 1099. There is a significant buying volume between 750 and 600 sats.
Decred (DCRBTC)
Decred Volume Profile
I have not written much about Decred, but that’s mainly because it has not presented many strong opportunities. But that may change here very soon. Decred has one of the strongest developed high volume nodes at its all-time lows. What is very exciting about this chart is the distance between the current high volume node and the POC. Decred is currently sitting right on the point at which we should begin to see it launch higher. There is a good 70+% gain that could be had if Decred marches back to the Point of Control.
ICON (ICXBTC)
 ICON Volume Profile
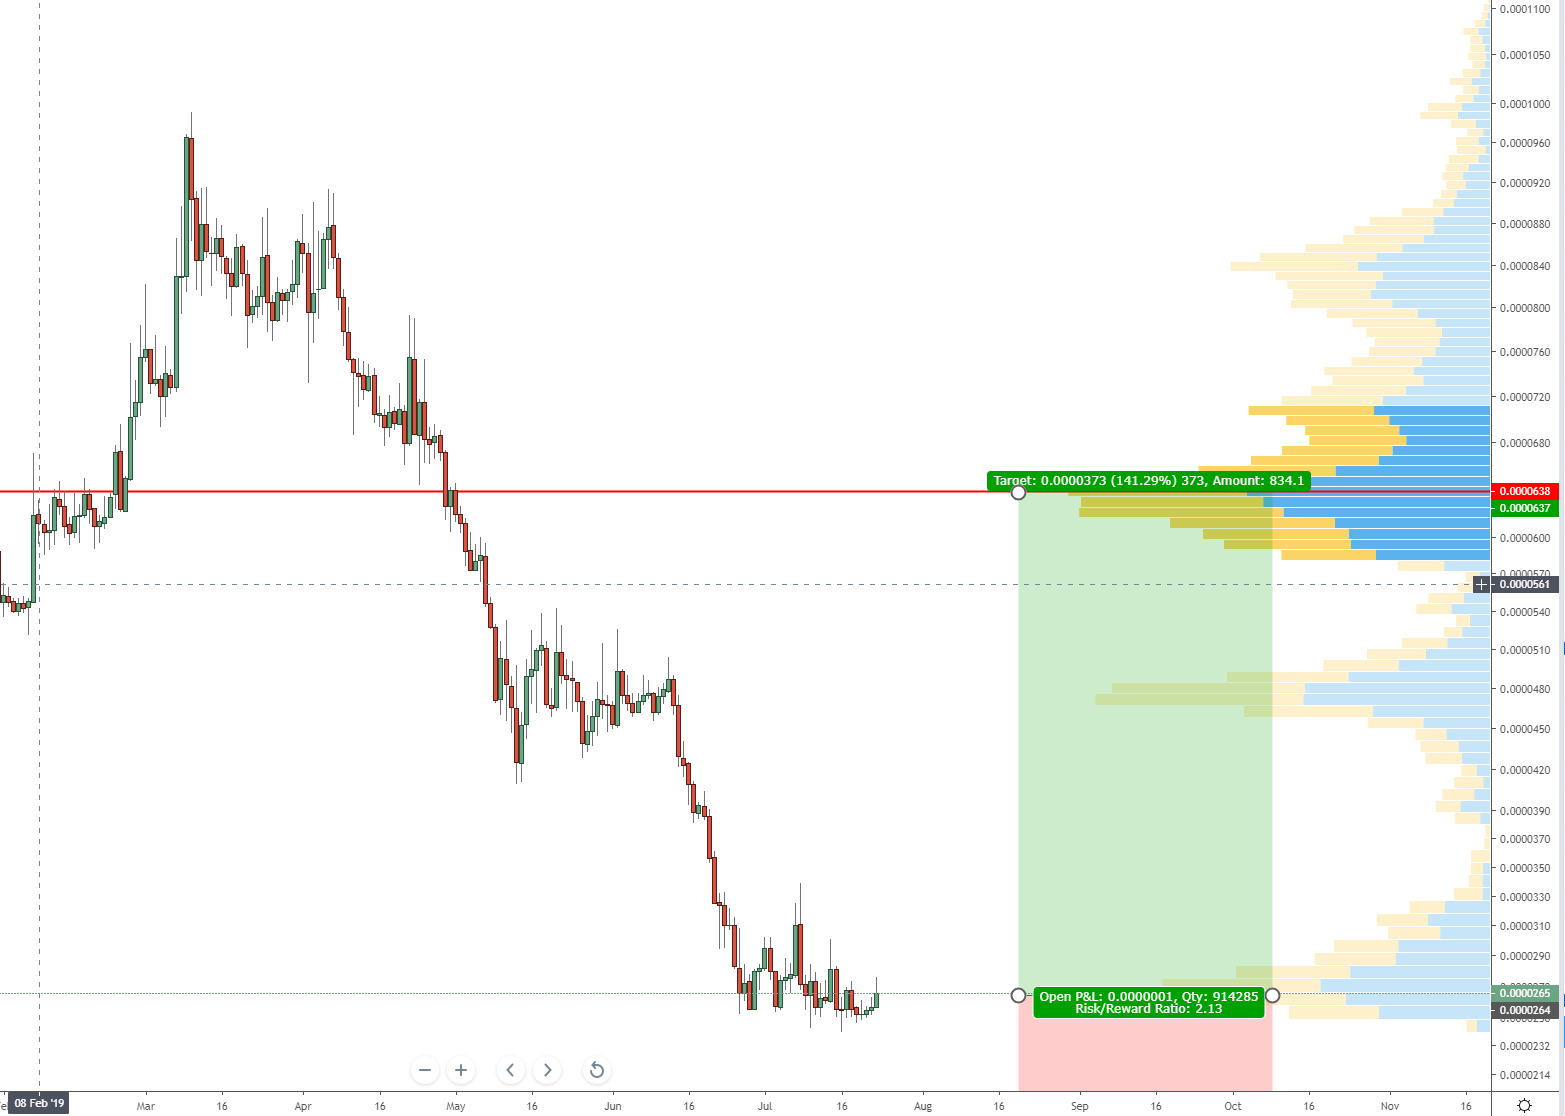
ICON has an equally exciting chart. There is a massive volume drought between the current high volume node that has just developed and the next high volume node at 476 sats. And after 476 there is another big open space until we reach the POC at 638 sats. A move from a break of the current high volume node to the POC would yield a whopping +141.29% gain.
NEXO (NEXOBTC)
 Nexo Volume Profile
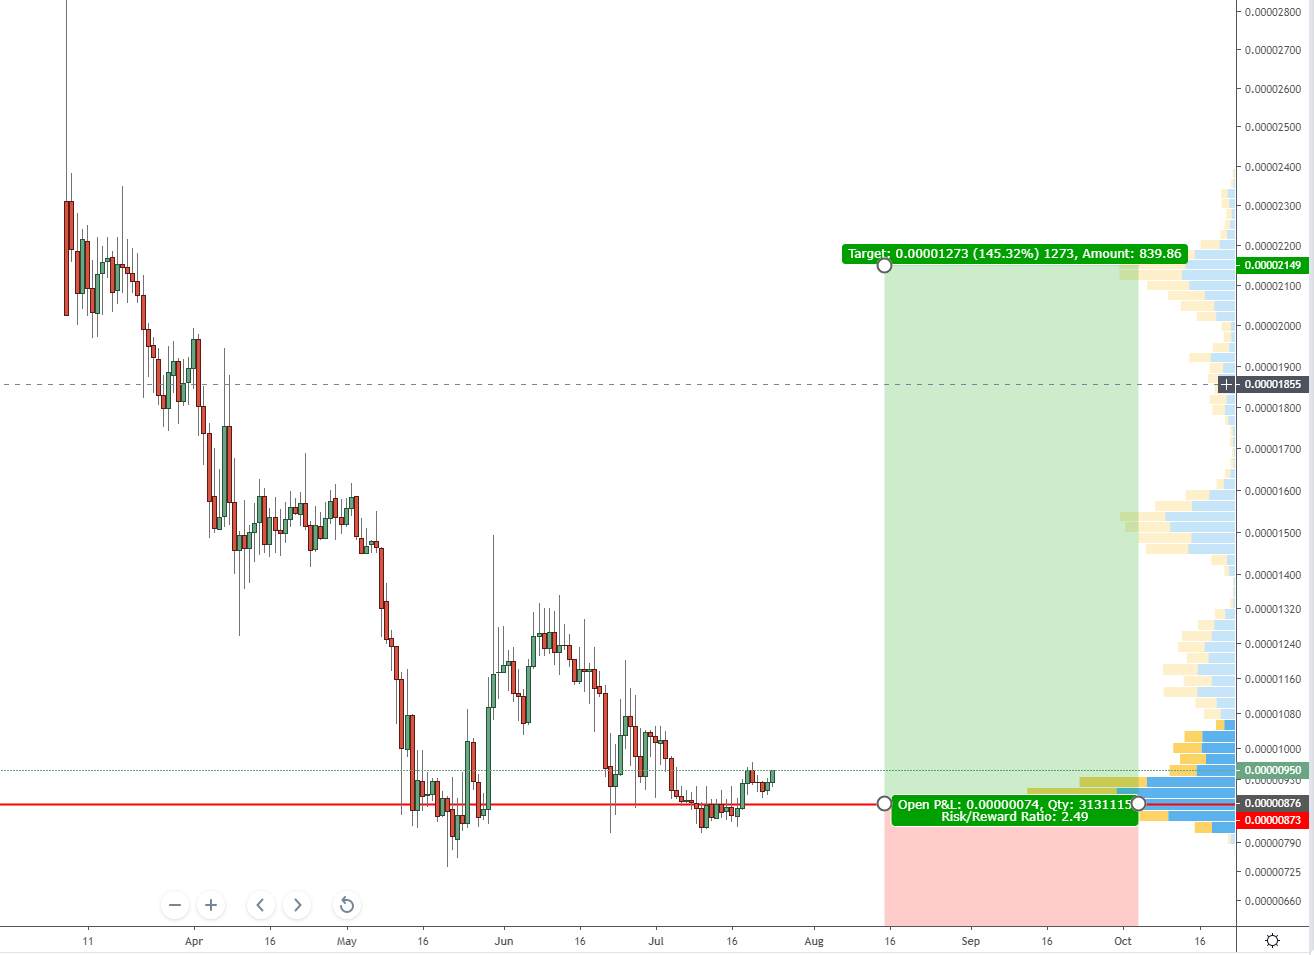
I have recently added some NEXO to my crypto portfolio after I dropped it when they failed to answer hodler requests on when the next ex-dividend date – or any dividend – would occur. They have since announced that and given information over this distribution. NEXO has hands down, the best looking chart for an awesome risk vs reward scenario. Not only is NEXO at an all-time low, but the all-time low generated the POC on this chart. This is an awesome opportunity for a long entry. Above the current trading, price is two high volume nodes: one at 1542 sats and the other at 2151 sats. If price can move to both of those high volume nodes, it would represent a 74% and 145% gain, respectively.