The psychological impact of three months of consolidation followed by an abrupt and violent crash can have a profound effect on the emotions of the participants. No one who is a consistent consumer of cryptocurrency news and price action is unaffected by the fast moves that cryptocurrencies can make. And it’s very easy to get caught up in the day to day moves that we forget to take a much more zoomed out view. Taking a look at how cryptocurrencies have faired over the whole month of September is a kind of ‘gotcha’ moment. I say that because there are a surprising number of bullish signals on many monthly charts in the cryptocurrency sphere.
0x
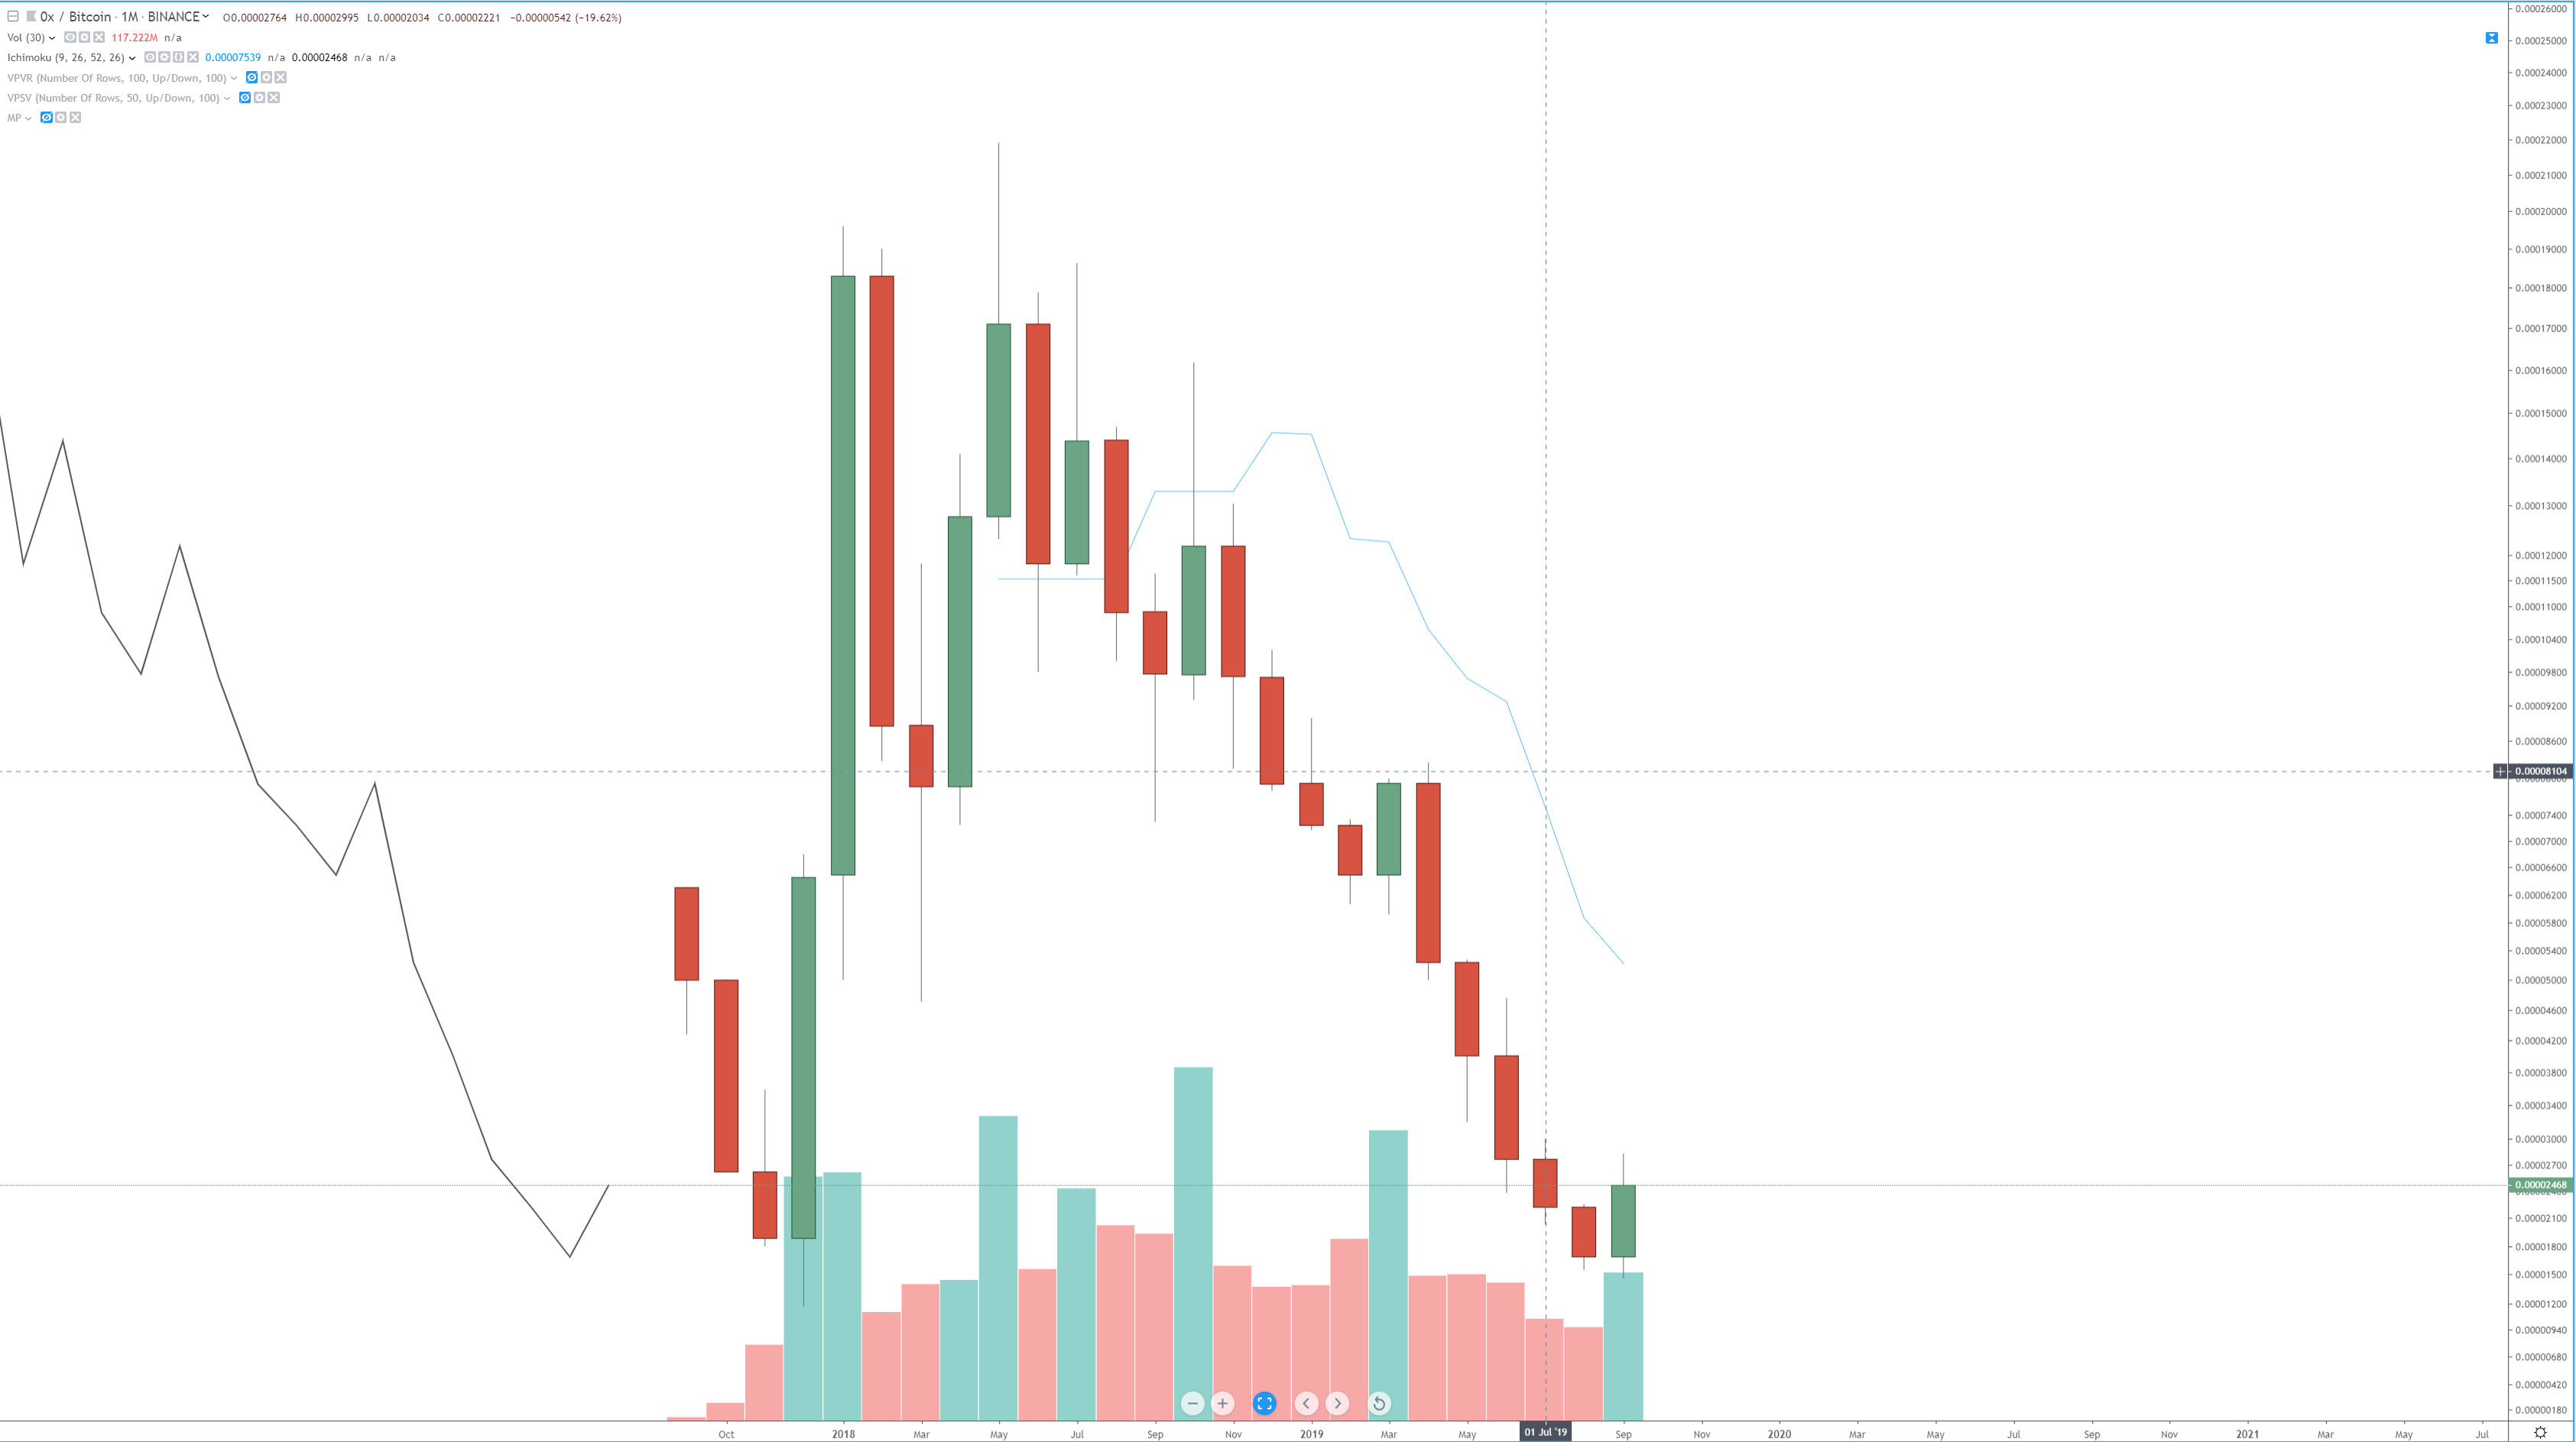 0x monthly reversal incoming?
Ox’s monthly chart is definitely one of the rarest altcoin charts you will find. First, I think it is important to review how ugly this chart is. Counting the number of months since the all-time high against Bitcoin (May 2018) we get 17 months of a bear market. What is really bearish is the number of months that have been green: only 4 out of 17 and none of them were consecutive. And in 2019, there was only one month where 0x had a close above it’s monthly open: March 2019. The last major swing high 0x experienced was in the month of April at the 8241 sats level. From April 2019 to the September 2019 low of 1465 sats, 0x dropped over -82.22% of its value. To add insult to injury on that percentage loss 0x has suffered the longest consecutive monthly bearish candles in its history – 5 consecutive months lower. But that has changed (unless something horrible happens between now and the close of today's trading). 0x has had an insane +46.06% gain against Bitcoin! Not only that, but it’s also gained +26.09% against the US Dollar. The current monthly candle is one of the most desired bullish reversal patterns you could ever want: bottom forming Bullish Engulfing Candlestick. The current monthly candle not only has a close above the open, but the close is also current above the entire range of August’s range. September also shows a lower low and higher than August. But the volume is what is the strong confirmation of a move higher. The monthly volume for September is greater than any of the past 5 months and is the third-highest volume month of 2019. I would expect to see some massive moves higher for 0x going into 2020.
Stellar
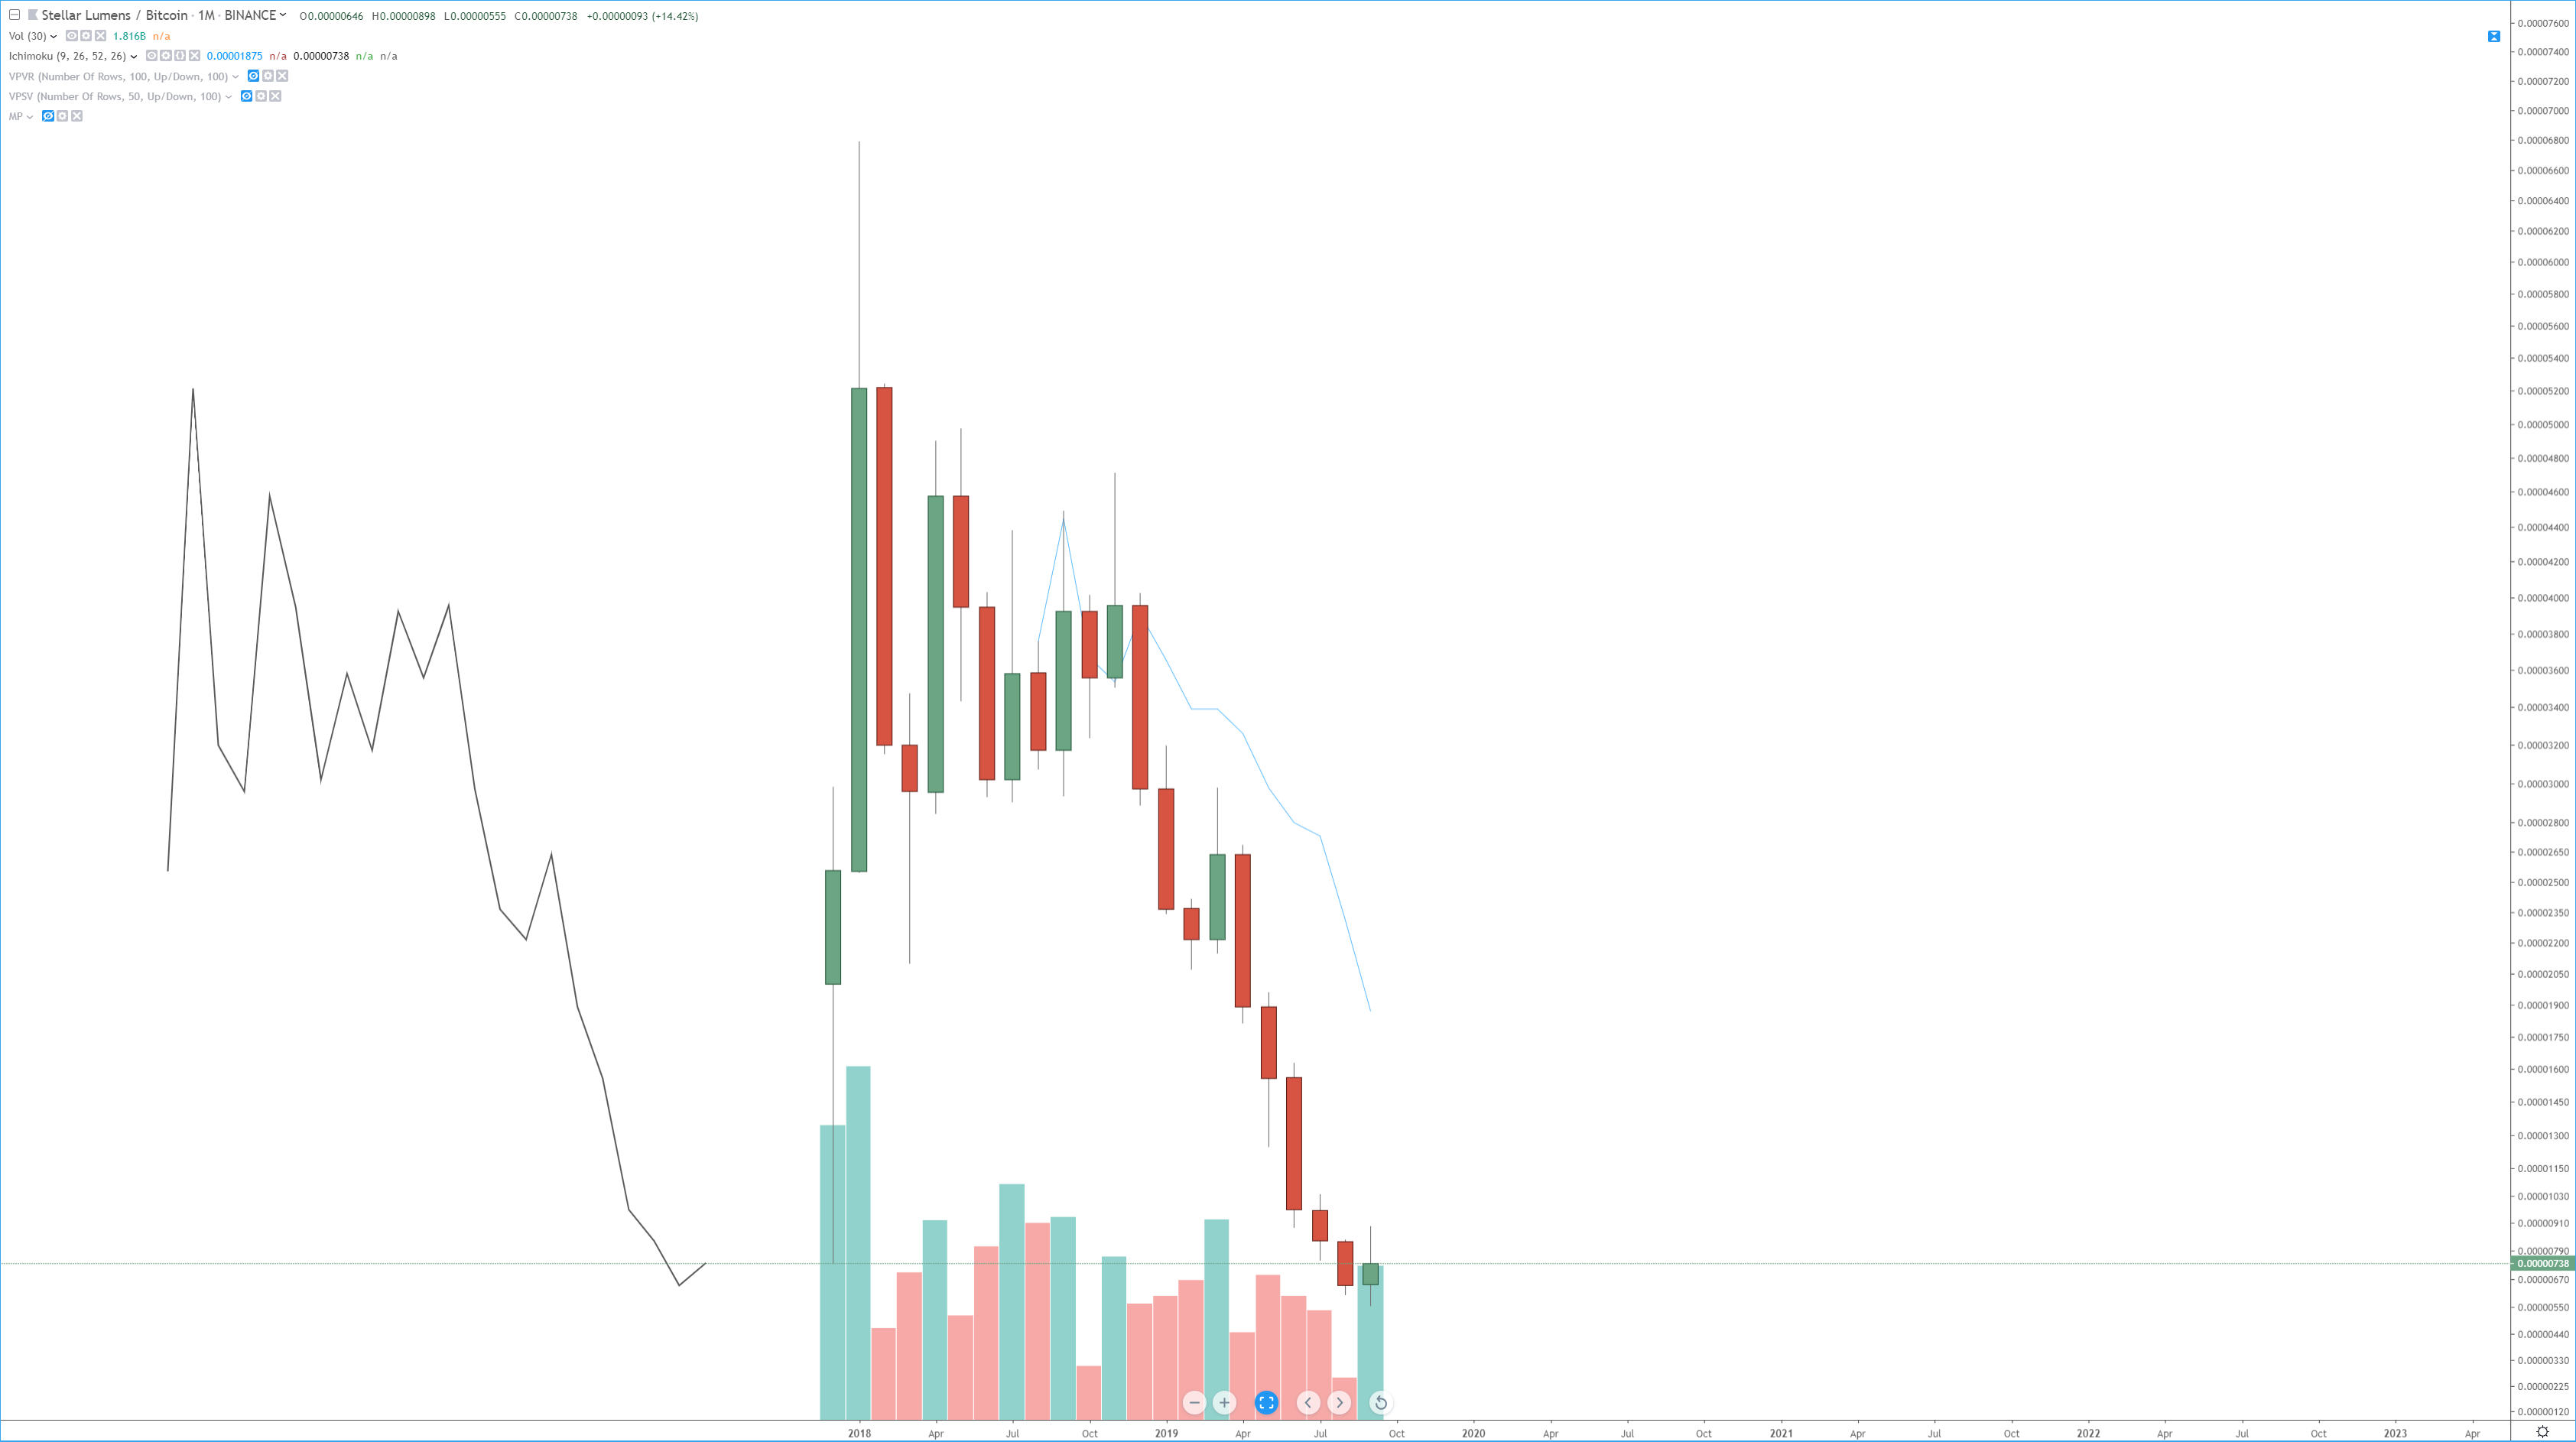 Stellar snaps 5 month losing streak.
Stellar has easily been one of the worst-performing altcoins of the past two years. The chart above is Stellar’s Bitcoin and from the all-time high back in January of 2018, Stellar has lost nearly -92% of its value. Stellars US Dollar pair is even worse: -95.39% from the same January 2018 highs. Stellar didn’t even get a pity rally at the beginning of 2019! It’s almost funny, but Stellar has had only one month in 2019 where it had a close above the open. And just like 0x, Stellar has spent the last 5 consecutive months trading lower. To add insult to injury, over the past 21 months, Stellar has had a whopping 5 total months where the close was above the open. But this current September 2019 monthly chart shows things are about to change. The current candlestick is called a ‘spinning top’. Not a top as in a direction, but a top like a toy. The probability of a bullish reversal is already high with this pattern, but if the upper shadow/wick is greater than the lower shadow and if it is also greater in length than the body, then a move higher is even more likely. But this chart, more than even 0x, has an even great signal for a reversal: Volume. The volume on Stellar’s chart is higher than any of the prior 5 months and is the second-highest volume of the past 10 months. From December 2018 to September 2019, the only month that saw higher volume than September 2019 was March 2019. And Septembers volume is more than 3.5x August. I would expect to see a strong move higher from here.
