Cardano (ADA), the leading third-generation blockchain has lead the Proof-of-Stake rally.
Cardano returns to the 10th most valuable cryptocurrency.
Cardano (ADA) pushes +16% gains
Cardano (ADA) is on a roll. All I have to say is, “IT’S ABOUT DAMN TIME!” I’ve made no secret that I have been a Cardano bull ever since the project was first announced – and I’ve remained one since 2017. I have added to my position consistently over the last two-plus years, especially when it has returned to the sub $0.10 value area. There is plenty of fundamental news that is positive to warrant this kind of a rise. Charles Hoskinson recently announced a partnership with IBM and Harvard University. But honestly, I don’t think that the news is a reason for this rally. It’s mostly due to technicals. Why do I believe this? Because the story about Cardano’s partnership with IBM And Harvard happened earlier in January 2020. Today’s rally (January 28th, 2020) is mostly due to the aggregate cryptocurrency market experiencing big drives higher.
Cardano (ADA)
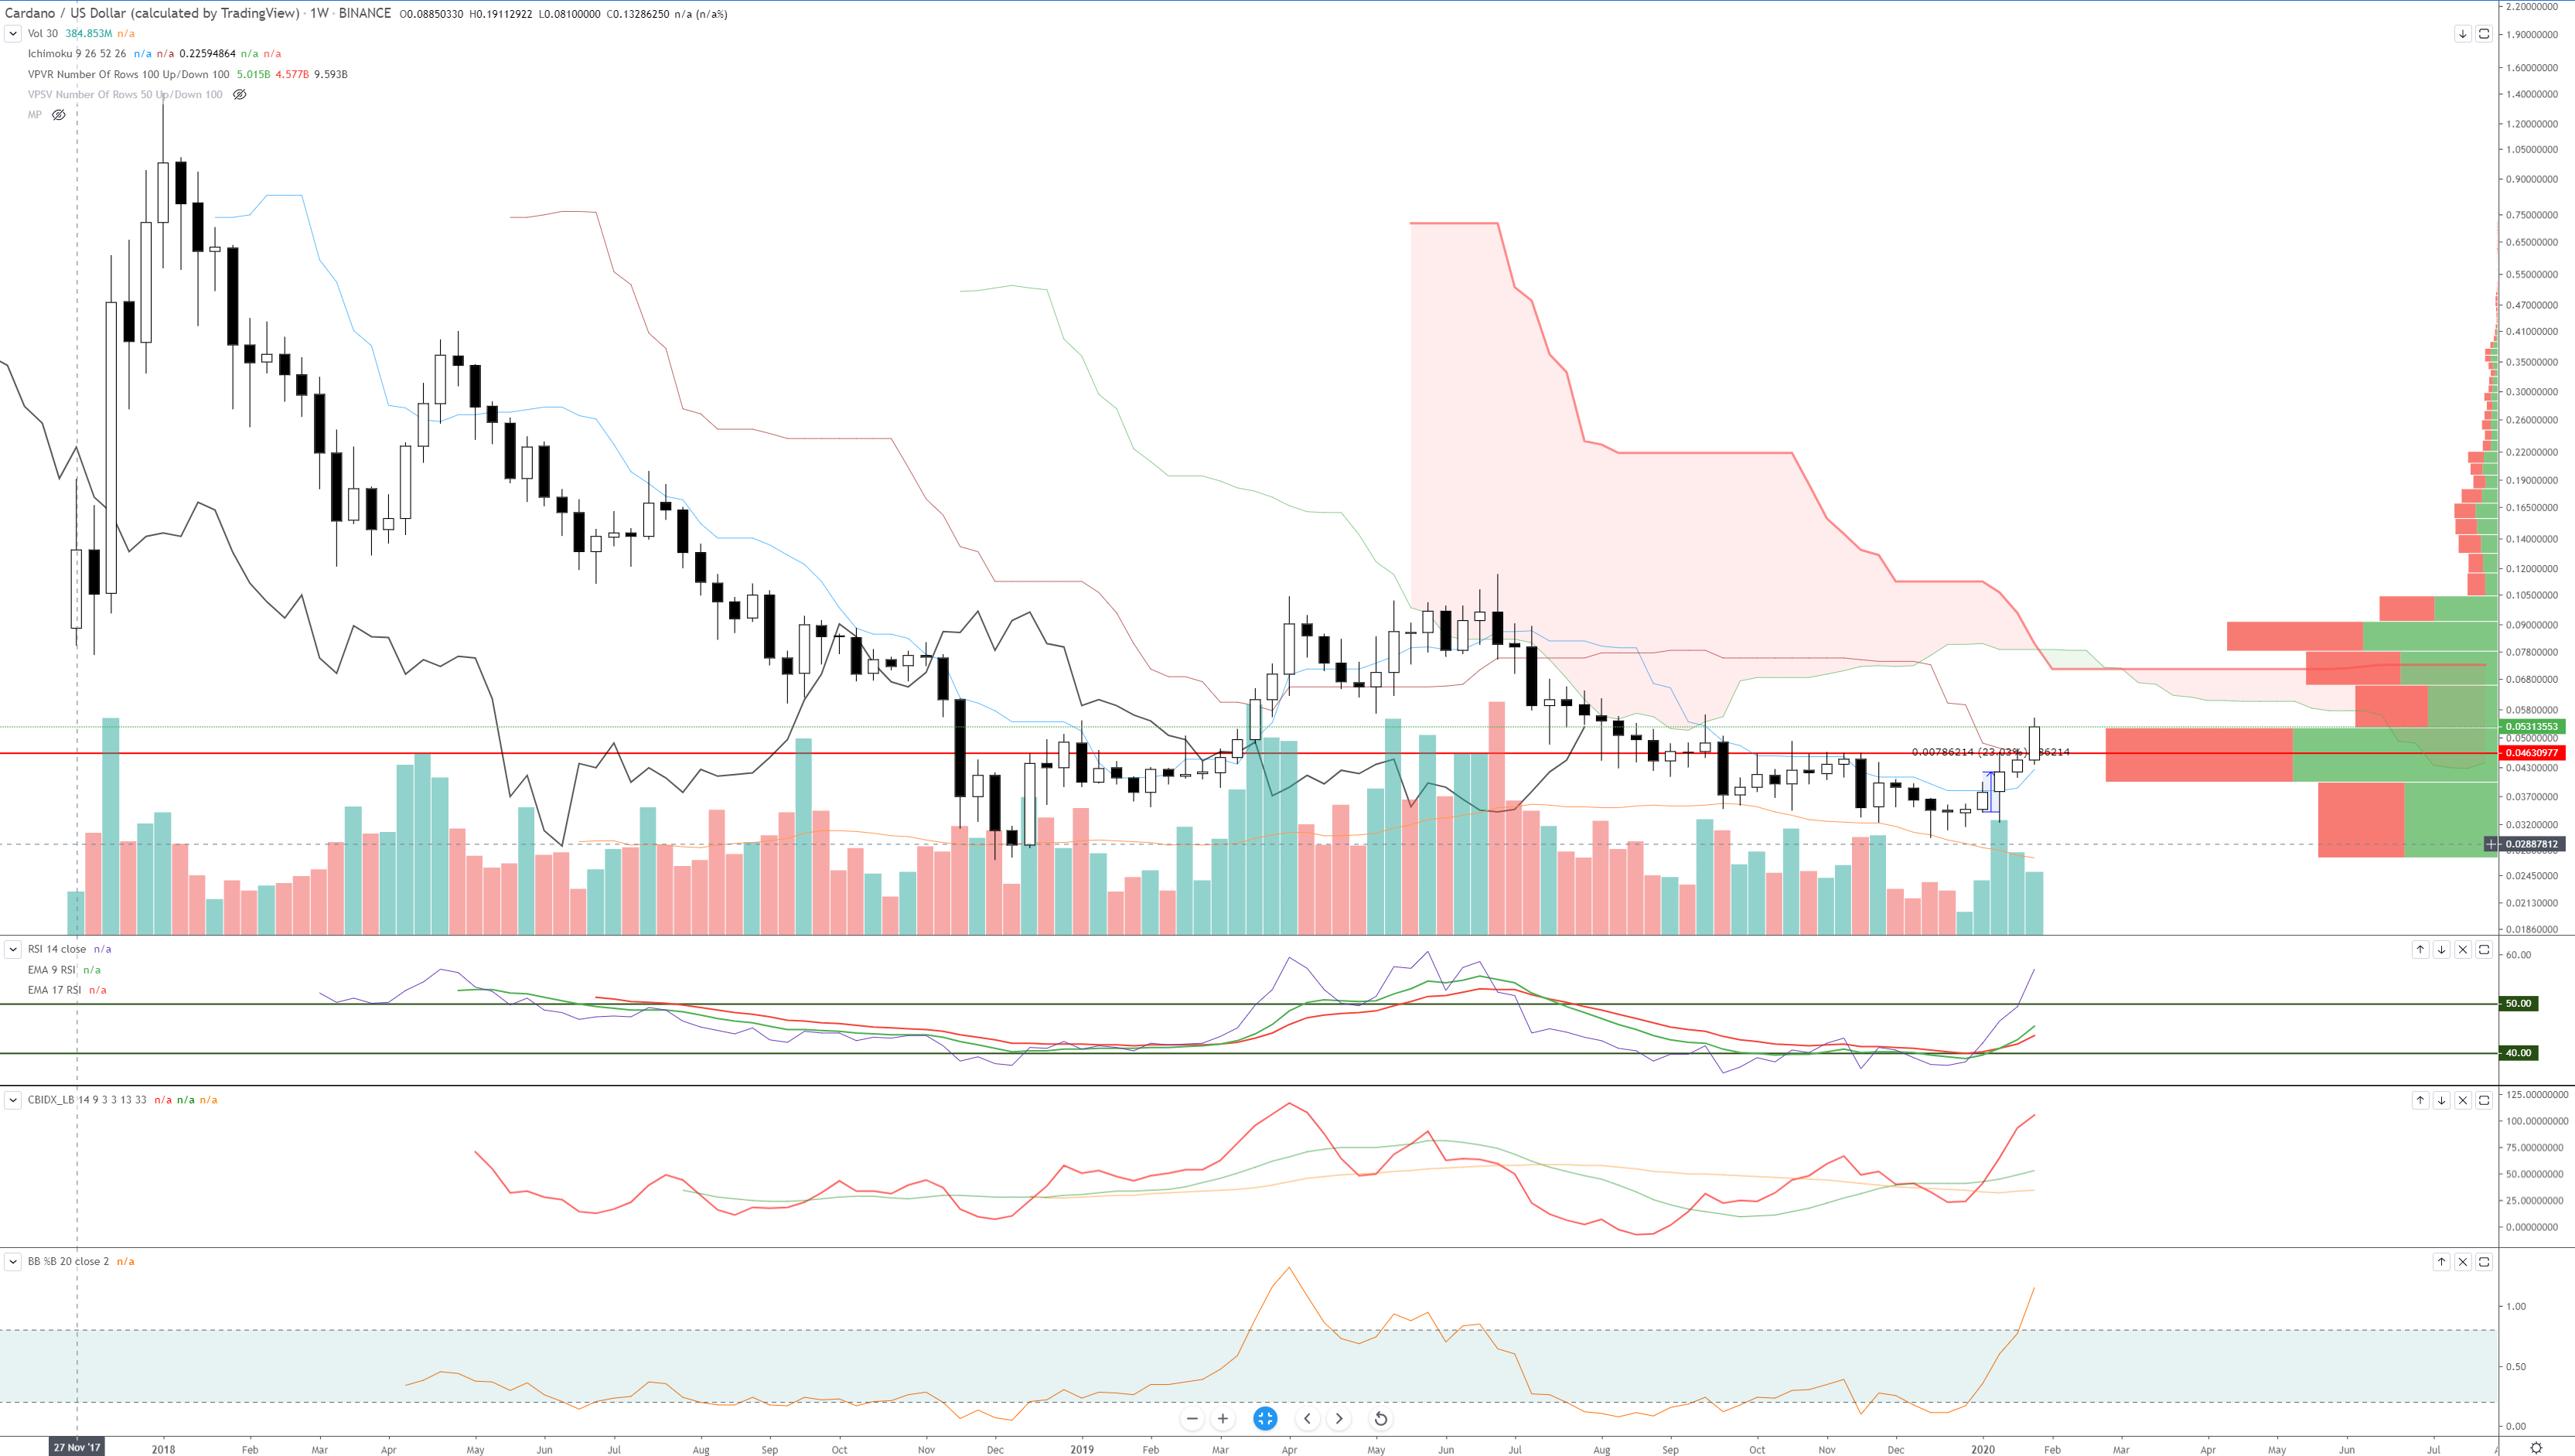
On the technical analysis side – Cardano is doing marvelously. The chart above is Cardano’s weekly Ichimoku chart. It is currently trading above the weekly Kijun-Sen for the first time since the week of July 8th, 2019. The current weekly candlestick is also the first candlestick to cross above the Kijun-Sen since the week of March 18th, 2019! One of the most important events that can occur on any weekly Ichimoku chart is for price action to cross above and then close above the Kijun-Sen. You often see prolonged rallies and new trends arise when price action does cross above this level. There is an aggressive trade strategy that targets explicitly taking a buy entry when price moves above the Kijun-Sen from below the Cloud. The only condition on the chart that needs to occur before the strategy could be utilized is for the weekly Chikou Span to cross above the candlesticks – something it is very close to doing.
Perhaps the most critical condition on the chart is non-Ichimoku related and that is the Volume Profile. The Volume Profile is on the right-hand side of the chart with horizontal columns that are red and green. Observe the thin red horizontal line on the chart. That red horizontal line is the VPOC or Volume Point Of Control. The VPOC represents the price level where the highest amount of Cardano has traded. This level is significant and represents one of the single most crucial support/resistance levels on any chart. This move, though bullish, demands further analysis.
Ok. Check out the weekly volume so far on Cardano’s chart. It’s a little over half of the volume traded during the week of January 13th (two weeks ago), and it’s very close to matching all of last week's volume. Why is that a big deal? Because Cardano is barely two days into the current weekly candlestick! The fact that Cardano has moved above the Kijun-Sen and the VPOC at the same time (they shared a price level) is enormous. But is it a fake-out? I don’t think so. The %B indicator below shows Cardano breaking out above the 0.8 level. This means that Cardano is piercing the upper band of the Bollinger Bands (not shown). The filter for whether this current move is a fakeout higher is to check where the RSI is at. If the RSI is already overbought, then the %B breakout above the 0.8 level would more than likely be a fakeout.

Cardano has never traded in a sustained bull market – ever. It has only ever traded in a bear market. Something very funny and peculiar is Cardano’s weekly RSI – it’s never traded above the 60 level. It’s never traded into the overbought default level at 70 on the weekly chart. I mean, TradingView doesn’t even show the level 70 area on the RSI because Cardano has been in a bear market since it first breathed its first breath on the chart. If Bitcoin moves above the 60 level on the RSI, we’re more than likely going to see the first bull run of Cardano’s existence. If there is a real rally beginning, it will last for months.
See live prices and historical data on all the cryptocurrencies we track. Quick links to bitcoin, ethereum and litecoin.