Deeper analysis of Litecoin’s current price action and projecting its future price levels.
Litecoin (LTC) is a chart that shows you how soul-crushing cryptocurrencies can be. If we measure from the 2018 bear market low of 25.73 on December 6th, 2018 to the next major swing high made on June 23rd, 2019, at 142.20, we can see why bulls were just nuts. Over a period of 197 days, Litecoin gained an astonishing +556.47%, easily crushing Bitcoin and Ethereum’s gains – up to that date. We then witnessed 179 days of Litecoin wiping out almost all of those gains to drop -75.42% to end 2019 at a dismal 41.10. Litecoin went from up +556% to gaining only +39.32% for 2019. Only in cryptocurrencies would we consider a gain of 39.32% as depressing!
But Litecoin is showing signs of like and signs of moving higher. I’ve often regarded Bitcoin as the DOW of cryptocurrencies, Ethereum (ETH) as the S&P 500, and Litecoin as the Nasdaq (I’ll have to change that up at some point). Litecoin is easily the most volatile out of the ‘big 3’ as I call them. Litecoin is, historically, a leader of moves for the aggregate cryptocurrency market. When Litecoin begins to make larger gains, you will see Bitcoin and then the rest of the market not far behind. When Litecoin begins to drop, you see everything else pause before jumping off the cliff to follow Litecoin. Litecoin is repeating the ‘leading’ behavior that we’ve historically seen it perform. Today (January 22nd, 2020) is another day where Litecoin is acting sneaky and making gains against both Bitcoin and Ethereum – Litecoin is currently up +1%, Bitcoin down -1.05%, and Ethereum down -1.06%.
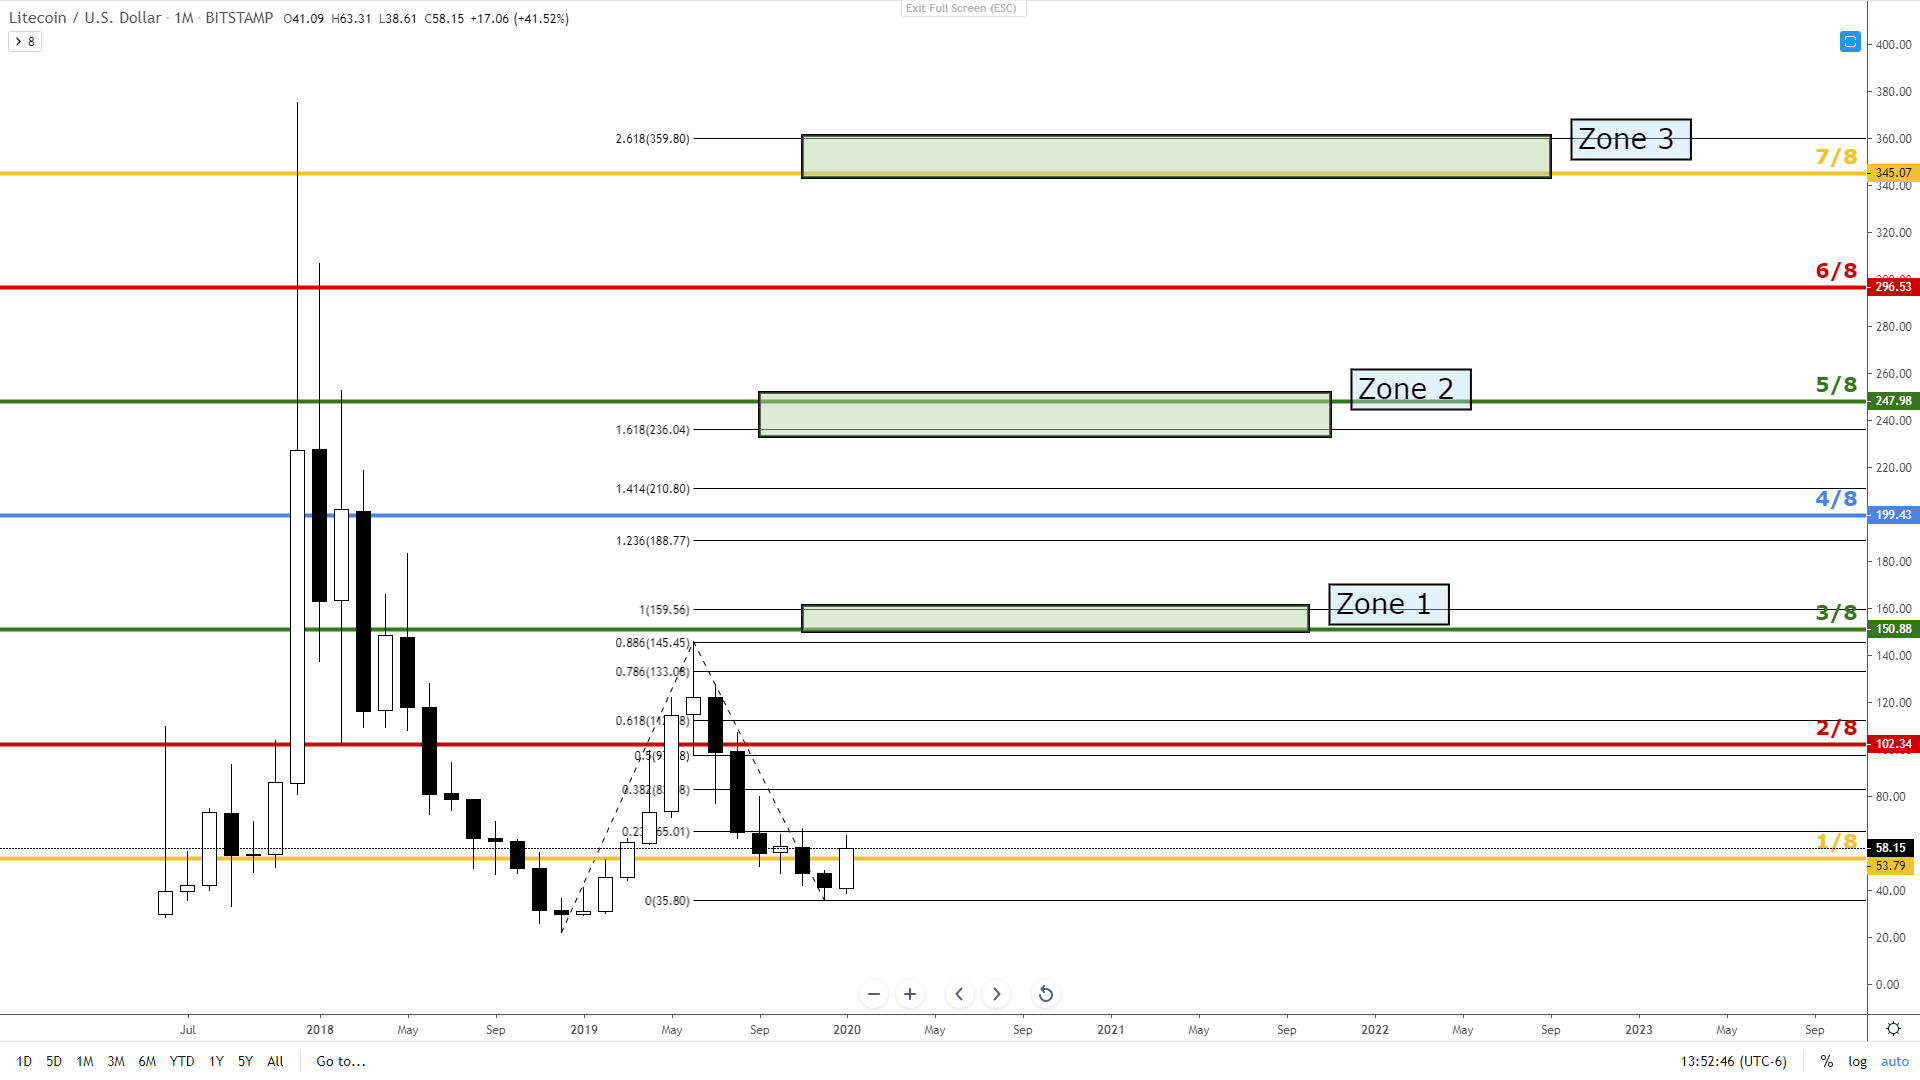
The most important condition I see on Litecoin’s chart is the return to the 1/8th Major Harmonic at $58. Litecoin previously returned to this value back on January 14th, 2020, and has oscillating around this value for over a week. If Litecoin holds the 1/8th Major Harmonic, we should expect a rocket launch higher for Litecoin – and then the rest of the cryptocurrency market. The trick here is to identify how far Litecoin can go and where we should expect to find resistance. There are several ways to project future profit and resistance, but I prefer to use Fibonacci extensions and then see if there are other, natural price levels that compliment the Fibonacci extensions.
The chart is linear, but the extensions are based on logarithmic measurements. The highlighted green rectangles show where I expect Litecoin to face the hardest areas of resistance in the future. I’ve identified them as Zones 1, 2, and 3. The Fibonacci extension is drawn from the December 18, 2018, swing low to the June 2019 swing high and then from the most recent December 2019 low.
Zone 1 – The easiest and most obvious of the three targets is Zone 1. Without needing any further pieces of analysis, one can assume that the $150 value area will be tested as resistance because it is both a psychological number and the price are where the most recent swing high was found. The other two pieces of technical analysis that help confirm Zone 1 as a primary resistance area is the 3/8th Major Harmonic at 150.88 and the 100% Fibonacci extension at $59.56.
Litecoin (LTC)
Zone 2 – Zone 2 is what I would consider being the first actual resistance test for Litecoin. The resistance zone is between the 5/8th Major Harmonic at 247.98 and the 1.618 Fibonacci extension at 236.04. This value area is also where Litecoin closed in December 2017 (closed at 227.16). Interestingly, the 3/8th Major Harmonic and the 5/8th Major Harmonic are known as the Lower Trading Range and Upper Trading Range (respectively) – it’s the area where we would expect to see Litecoin spend the most amount of time trading.
Zone 3 – Zone 3 is the major extension and retest zone of the all-time high. The value area for this resistance zone is the 7/8th Major Harmonic at 345.07 and the 2.618 Fibonacci extension at 359.80. If Litecoin does reach this zone, I intended to exit a great majority of my position and add on any dips or any confirmed break towards new all-time highs.