


 FxWirePro- Gold Daily Outlook
  Joe Biden Proposes Record 44.6% Capital Gains Tax in Latest Budget Plan That May Favor Cryptocurrencies
  FxWirePro- BTCUSD Daily Outlook
  FxWirePro: GBP/NZD consolidates around 2.0980,bias is bullish
  Impact of Iran-Israel conflict on Stocks, Gold and Bitcoin
  FxWirePro: GBP/NZD propelled towards 2.0990 by strong UK PMI data, good to buy on dips
  FxWirePro- BTCUSD Daily Outlook
  New Crypto Whale Snags 237.8 Billion SHIB Following Key Shiba Inu Blockchain Announcement
  FxWirePro- Gold Daily Outlook
  FxWirePro: EUR/AUD heads deeper into bear territory, 1.6512 a key barrier
  SEC Postpones Grayscale's Ethereum ETF Decision Amid Tighter Crypto Scrutiny
  FxWirePro- Ethereum Daily Outlook
  Shiba Inu's Burn Rate Surges 2200%, Fuels Bullish Sentiment and Speculation on Future Price Gains
  FxWirePro- Gold Daily Outlook


Quite a few analysts were bullish about the recent week’s BTC price bounce from $6,854, we’ve been one among them because of couple of technical bullish driving forces.
While articulating the bitcoin price (BTCUSD at Coinbase exchange) has risen more than 15.75% in this month so far.
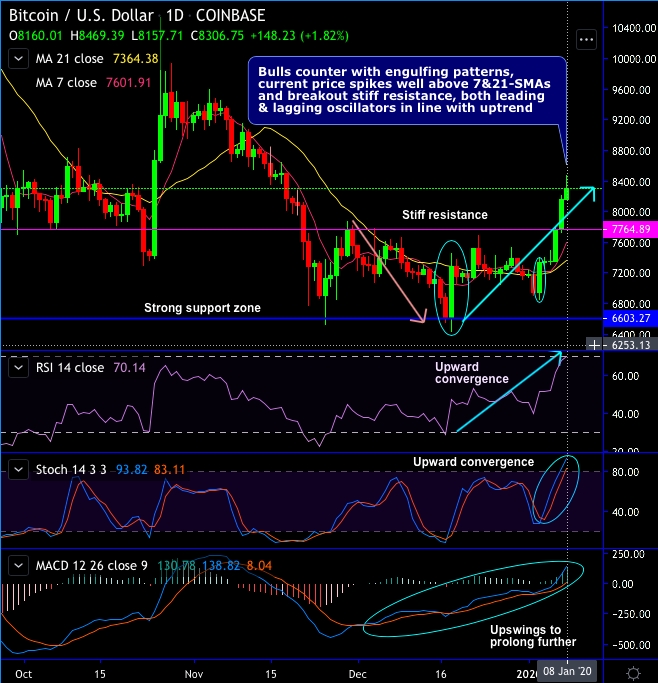
Technically, bulls counter with engulfing patterns at $7,285 and $7,334 levels, consequently, the minor trend spikes well above 7 & 21-DMAs.
As there was a higher low than the asset’s previous cycle low of US$6,500 which it hit in mid-December 2018, and the current price has broken out stiff resistance of $7,764 and hit $8,000 levels, now is on the verge of $8,500 level. We could now foresee further upside traction as both leading & lagging oscillators in line with uptrend (refer daily chart).
Both RSI & Stochastic curves show upward convergence to the ongoing upswings that indicates the intensified buying momentum. While bullish MACD & DMA crossover signal prevailing uptrend to prolong further.
Shooting star followed by hanging man patterns plummet prices below EMAs, Hammer & Dragonfly Doji counters at $7,513 and $7,355 levels respectively (refer weekly plotting).
Bulls will hope that all these patterns are indicative of a trend reversal. When an asset’s price consistently makes higher lows or higher highs towards the end of a cycle, this can be a sign of an impending price break-out.
Accordingly, we’ve recently setup a trading and hedging strategy so as to participate in the prevailing bullish run.
It seems to have been fetched the desirable yields by now as we had given targets of $8,500 level. Contemplating above technical factors, we wish to uphold the same strategy on hedging grounds (current spot reference: $8,310 with day highs at 8,469 levels).


